Rate of Reactions
10. Rate of Reactions
Continue where you stopped
The core idea
On this page
Learning objectives
- describe the effect of concentration, pressure, particle size and temperature on the rates of reactions and explain these effects in terms of collisions between reacting particles
- interpret data obtained from experiments concerned with rate of reaction.
A reaction rate tells you how quickly a measurable quantity changes. This lesson keeps three ideas connected: what you observe, what the graph shows, and how particle collisions explain the pattern.
1. Definition
The rate of reaction is the change in the amount of a reactant used up or product formed per unit time.
The unit depends on the measured quantity. Examples include cm³ s⁻¹ for gas volume and g s⁻¹ for mass loss.
2. Key Ideas
| Evidence | Rate meaning | Particle meaning |
|---|---|---|
| Steeper volume–time curve | More gas forms per unit time | Reacting particles collide more frequently |
| Steeper downward mass–time curve | Gas escapes more quickly | Reactant is converted to gaseous product more quickly |
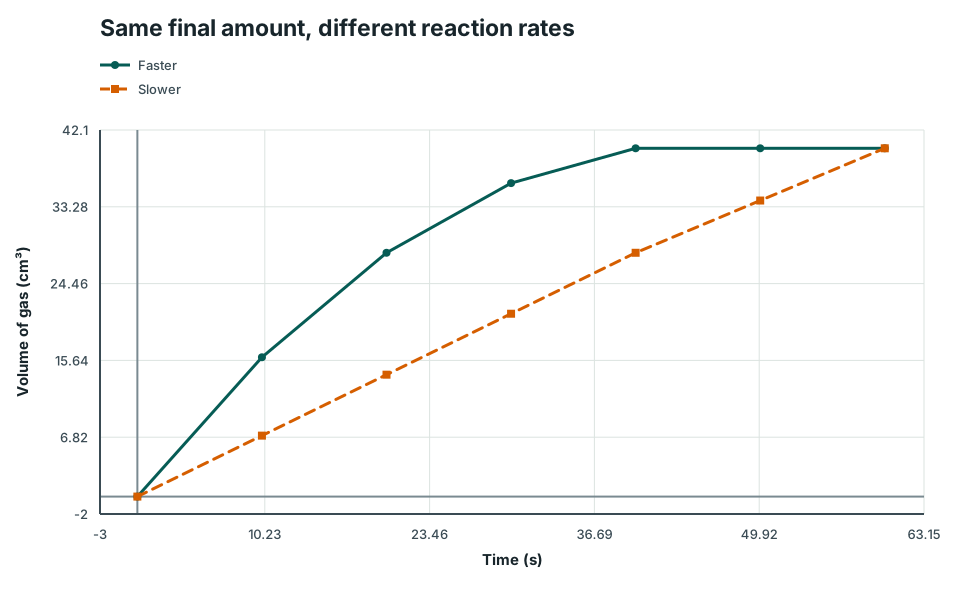
| Same final volume, reached sooner | Faster rate, same final amount | The starting conditions changed collision frequency, not the limiting amount |
| Curve becomes horizontal | Rate is zero | A reactant has been used up or the reaction has effectively stopped |
The gradient describes rate. The final height describes total gas produced. A steeper curve can finish at the same height.
3. Detailed Explanations
Measuring a reaction rate
- Gas syringe: record gas volume at regular time intervals.
- Mass loss: record the decrease in mass as a gaseous product escapes. Use cotton wool to reduce spray while allowing gas to leave.
- Fixed visual change: time how long a marked cross takes to disappear as a precipitate forms. Compare only experiments with the same end-point.
Swipe or scroll sideways to inspect the complete overview.
Same final amount, different reaction rates
Two gas-volume against time curves. The faster reaction has the steeper initial gradient and reaches the same final volume earlier.
Scroll across the graph to read all labels.
View figure data
| Time (s) | Faster | Slower |
|---|---|---|
| 0 | 0 | 0 |
| 10 | 16 | 7 |
| 20 | 28 | 14 |
| 30 | 36 | 21 |
| 40 | 40 | 28 |
| 50 | 40 | 34 |
| 60 | 40 | 40 |
The four prescribed factors
- Higher concentration: there are more reactant particles per unit volume, so collisions occur more frequently and rate increases.
- Higher pressure for reacting gases: the gas particles are closer together, so collisions occur more frequently and rate increases.
- Smaller solid particles: the same mass has a larger total surface area, so collisions at the solid surface occur more frequently and rate increases.
- Higher temperature: particles move faster, so collisions occur more frequently and rate increases.
For this G3 Science topic, use particle motion and collisions between reacting particles. Catalyst definitions, activation energy, alternative pathways and collision orientation belong to G3 Chemistry.
Planning a fair investigation
Change one factor. Keep the amounts of reactants and all other rate factors constant. Measure the same quantity at regular times, repeat each condition, identify anomalies and calculate a mean from justified valid results.
4. Common Mistakes
- Saying a larger volume of acid means a higher concentration. Concentration is particles per unit volume.
- Saying pressure affects a reaction between solutions. Pressure is a rate factor here only when reacting particles are gases.
- Saying smaller solid particles have less mass when the experiment uses the same total mass.
- Saying the faster experiment makes more product without checking the final graph value.
- Comparing times when the measured end-points are different.
5. Exam Tips
State what changes at particle level, state that collisions occur more frequently per unit time, then link this to the higher reaction rate.
Exam question 1: Control a concentration investigationCore
A student changes acid concentration and measures hydrogen volume every 10 s. Name three variables that should be controlled.
Show Answer
Keep the volume of acid, mass and surface area of the magnesium, and temperature constant. Use the same apparatus and timing method in each run.
6. Worked Examples
Modelled example 1
Calculate an average rate
Problem
Study the worked solution
Identify change and time
Method
Use the 36 cm³ product increase over 45 s.Reason
Reaction rate compares a measurable change with its elapsed time.Working
Change = 36 cm³; time = 45 s.Calculate and report
Method
Divide gas volume by time.Reason
The average is taken across the full stated interval.Working
36/45 = 0.80 cm³ s⁻¹.
Guided practice 2
Plan a concentration comparison
Problem
Change concentration only
Hints
Hint 1: product
Hint 2: fair test
View solution step by step
Choose the evidence
Method
Record carbon-dioxide volume at fixed time intervals using a gas syringe.Reason
The readings produce a volume–time curve whose gradient represents rate.Working
gas volume / cm³ against time / sControl the comparison
Method
Keep marble mass, marble surface area, acid volume and temperature constant.Reason
Each could otherwise change rate or final gas amount.Working
change concentration only; hold all other rate factors constant
Common misconception 3
Compare two curves
Learner claim
Read gradient and final height separately
View solution step by step
Compare rates
Method
Choose Curve A as faster.Reason
It reaches the same fixed gas volume in less time and therefore has the steeper gradient.Working
A reaches 50 cm³ in 40 s; B takes 90 s.Compare final amounts
Method
State that both produce 50 cm³ in total.Reason
The final graph height represents accumulated product, not how quickly it formed.Working
Same final amount; different rates.
Examiner practice 4
Explain the temperature effect
Examination question
Build a linked particle explanation
View solution step by step
Change particle motion
1 markMethod
State that reacting particles move faster at the higher temperature.Reason
Heating increases their motion.Working
higher temperature → faster-moving particlesChange encounters
1 markMethod
State that particles meet more often.Reason
Faster motion produces more collisions in a given time.Working
faster motion → more collisionsUse the time phrase
1 markMethod
State that collisions occur more frequently per unit time.Reason
Rate compares change with time, so the time link matters.Working
collision frequency per second increasesReach the rate
1 markMethod
Conclude that reactant is used or product is formed more quickly.Reason
More frequent reacting-particle collisions increase the measured rate.Working
more product per unit time → higher rate
Self-mark with the mark scheme
Compare your response with each mark point. Select a point only when your response contains that evidence.
Keep the answer at the stated course depth; activation energy is not needed.
Challenge 5
Explain a surface-area effect
Factor transfer
Build the surface-to-rate chain
Hints
Hint 1: same mass
View solution step by step
Compare exposed marble
Method
Give the powdered sample a larger total surface area.Reason
Breaking the same 5.0 g mass into smaller particles exposes more marble particles.Working
Powder has more accessible surface.Connect exposure to rate
Method
Increase collisions at the marble surface per unit time.Reason
More exposed sites allow acid particles to meet marble particles more frequently.Working
More frequent collisions per unit time, so the reaction rate is higher.
7. Mind Stretchers
Mind stretcher 1: Separate rate from final amountExtension
Two experiments reach the same final gas volume, but one curve is initially twice as steep. What can and cannot be concluded?
Show Answer
The steeper curve shows a higher initial rate. The matching final volumes show the same final amount of gas. The graph alone does not identify which rate factor was changed.
Mind stretcher 2: Evaluate an anomalous repeatExtension
Times for a cross to disappear are 42 s, 43 s and 71 s. Identify the anomaly and state the next step.
Show Answer
71 s is anomalous because it is far from the two concordant values. Check whether the quantities, temperature, mixing and viewing end-point were controlled, repeat the condition, then calculate a mean from justified valid results.
Mind stretcher 3: Keep the explanation at course depthExtension
A student writes, “Heating increases concentration.” Correct the explanation using this course’s particle model.
Show Answer
Heating does not increase concentration. At higher temperature, particles move faster and collide more frequently per unit time, so the reaction rate increases.
8. Quiz
Check 1: Check your understandingCore
Check rate units, graphs, fair tests and collision explanations, then practise whichever part felt least secure.
Check your understanding