Titration Curves and Indicators
Read acid–base titration curves and choose a suitable indicator.
On this page
Titration curve questions are mainly “read the shape, then justify”: identify the titration type (strong/weak), locate the equivalence point, and choose an indicator whose transition range sits inside the steep pH jump. This lesson also explains the half-equivalence shortcut (pH = pKₐ) for weak acid–strong base titrations.
If the acid-base foundations feel rusty, revisit Acids and Bases (Theories) and keep the Aqueous Equilibria hub open for linked methods.
Definitions (Must Know)
A. Equivalence point
The equivalence point is the point where acid and base have reacted in the exact stoichiometric ratio.
B. End-point
The end-point is the point where the indicator changes colour.
C. Half-equivalence point (weak acid/weak base titrations)
The half-equivalence point is when half the initial acid/base has been neutralised. For a weak acid–strong base titration, pH = pKₐ at the half-equivalence point.
Key Ideas (What Earns Marks)
- The equivalence point is not always pH 7 (it depends on strong/weak acid/base).
- A buffer region appears when a weak acid/base and its conjugate are both present in significant amounts.
- Choose an indicator whose transition range lies within the steep part of the curve near the equivalence point.
- Many titration questions are two-step: do stoichiometry first (what is present?), then equilibrium (what is the pH?).
Titration type summary:
| Titration type | pH at equivalence | Indicator rule-of-thumb |
|---|---|---|
| strong acid + strong base | ≈ 7 | many indicators work |
| weak acid + strong base | > 7 | indicator transition in basic range |
| strong acid + weak base | < 7 | indicator transition in acidic range |
| weak acid + weak base | small pH jump | indicator unreliable; use pH meter |
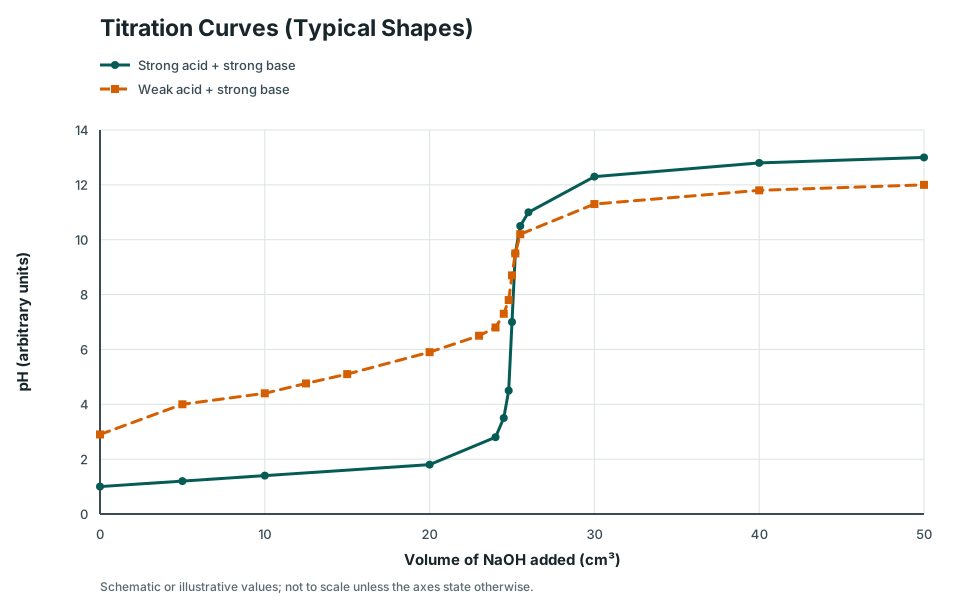
Titration Curves (Typical Shapes)
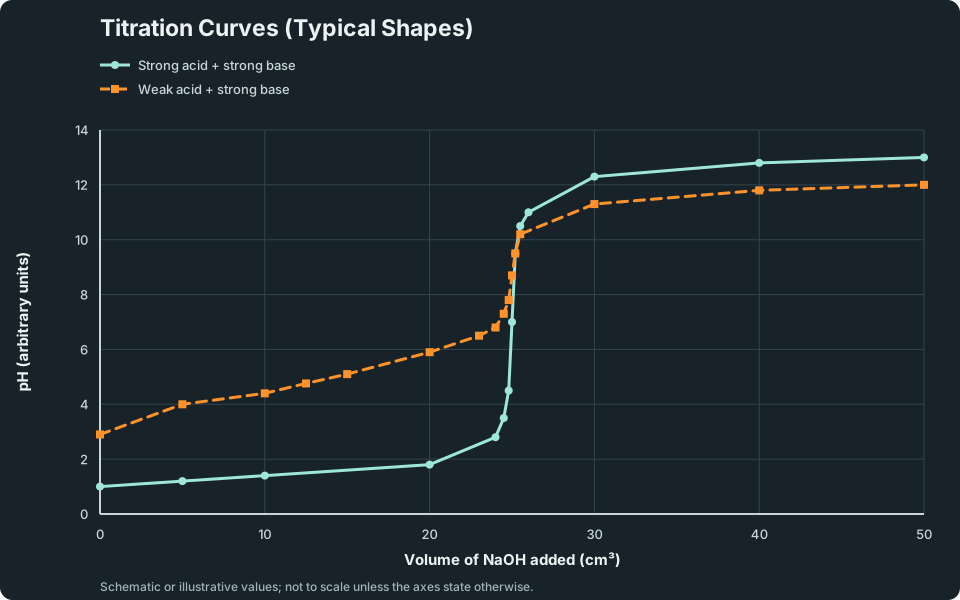
Titration Curves (Typical Shapes). Strong acid + strong base, Weak acid + strong base plotted as pH against Volume of NaOH added.
Scroll across the graph to read all labels.
View figure data
| Series | Volume of NaOH added (cm³) | Volume of NaOH added uncertainty | pH (arbitrary units) | pH uncertainty |
|---|---|---|---|---|
| Strong acid + strong base | 0 | 1 | ||
| Strong acid + strong base | 5 | 1.2 | ||
| Strong acid + strong base | 10 | 1.4 | ||
| Strong acid + strong base | 20 | 1.8 | ||
| Strong acid + strong base | 24 | 2.8 | ||
| Strong acid + strong base | 24.5 | 3.5 | ||
| Strong acid + strong base | 24.8 | 4.5 | ||
| Strong acid + strong base | 25 | 7 | ||
| Strong acid + strong base | 25.2 | 9.5 | ||
| Strong acid + strong base | 25.5 | 10.5 | ||
| Strong acid + strong base | 26 | 11 | ||
| Strong acid + strong base | 30 | 12.3 | ||
| Strong acid + strong base | 40 | 12.8 | ||
| Strong acid + strong base | 50 | 13 | ||
| Weak acid + strong base | 0 | 2.9 | ||
| Weak acid + strong base | 5 | 4 | ||
| Weak acid + strong base | 10 | 4.4 | ||
| Weak acid + strong base | 12.5 | 4.76 | ||
| Weak acid + strong base | 15 | 5.1 | ||
| Weak acid + strong base | 20 | 5.9 | ||
| Weak acid + strong base | 23 | 6.5 | ||
| Weak acid + strong base | 24 | 6.8 | ||
| Weak acid + strong base | 24.5 | 7.3 | ||
| Weak acid + strong base | 24.8 | 7.8 | ||
| Weak acid + strong base | 25 | 8.7 | ||
| Weak acid + strong base | 25.2 | 9.5 | ||
| Weak acid + strong base | 25.5 | 10.2 | ||
| Weak acid + strong base | 30 | 11.3 | ||
| Weak acid + strong base | 40 | 11.8 | ||
| Weak acid + strong base | 50 | 12 |
- Equivalence point: stoichiometric neutralisation (ratio matched). - End-point: indicator colour change (what you observe).
Detailed Explanations
A. What curve features mean (and why equivalence pH shifts)
Common features:
- Initial pH depends on the analyte in the flask (strong acids start lower pH than weak acids at the same concentration).
- Buffer region appears when a weak acid/base and its conjugate are both present (gentle slope).
- Equivalence point is the stoichiometric neutralisation point (steep region).
Because a weak acid–strong base equivalence mixture contains the conjugate base A⁻, therefore A⁻ hydrolyses water to form OH⁻ and the equivalence pH is > 7.
B. Workflow: interpreting a titration curve question
- Identify the titration type using the initial pH and the equivalence pH (strong/weak clues).
- Locate the equivalence point at the midpoint of the steep vertical section.
- For a weak acid/weak base titration, find the half-equivalence point (half the equivalence volume).
- Choose an indicator whose transition range sits inside the steep vertical section near equivalence.
Mini example: If a curve starts around pH 3 and the equivalence point is above pH 7, it is consistent with a weak acid titrated by a strong base.
C. Why pH = pKₐ at the half-equivalence point (weak acid + strong base)
At half-equivalence, half the weak acid has been converted to its conjugate base, so [HA] = [A⁻].
Substitute into Henderson–Hasselbalch:
D. Try it: titrate and read the curve
Titrate ethanoic acid with sodium hydroxide below, then change the acid, base and indicator to see how the curve and the end-point move.
25.0 cm³ of 0.100 mol/dm³ ethanoic acid with phenolphthalein. 0.00 cm³ of 0.100 mol/dm³ sodium hydroxide added; the pH is 2.88 and the solution is colourless.
- Volume added
- 0.00 cm³
- pH
- 2.88
- [H⁺]
- 0.0013 mol/dm³
- Titration
- 1 (rough)
Try this
0 of 4 doneWith universal indicator, add alkali to hydrochloric acid until the solution turns violet. (not done yet)
The colour runs from red through green to violet as OH⁻ ions remove H⁺ ions (H⁺ + OH⁻ → H₂O). Near neutralisation one drop takes the pH from about 4 to 10.
Titrate ethanoic acid with sodium hydroxide to the end point twice: once with methyl orange and once with phenolphthalein. (not done yet)
The steep part runs from about pH 7.5 to 10, so phenolphthalein or thymolphthalein changes within a drop of equivalence. Methyl orange changes in the buffer region, far too early.
Titrate ethanoic acid with sodium hydroxide past equivalence, then drag the graph cursor to the half-equivalence point. (not done yet)
Half the CH₃COOH has become CH₃COO⁻, so the two concentrations are equal and pH = pKₐ = 4.76. Around this point the curve is flattest: the buffer region.
Find the concentration of a sodium hydroxide sample: do a rough titration, then accurate ones until two titres agree within 0.20 cm³. (not done yet)
Average the concordant titres. Moles of HCl = concentration × titre; the 1 : 1 ratio gives the moles of NaOH in 25.0 cm³, so divide by 0.0250 dm³.
Your readings
| # | Final reading / cm³ | Initial reading / cm³ | Titre / cm³ | Remove |
|---|---|---|---|---|
| No readings yet. Set up a measurement, then record it. | ||||
Worked Examples
Modelled example 1
Explain an alkaline equivalence point
Problem
Study the worked solution
Identify the equivalence mixture
Method
Recognise that the weak acid has been converted to its conjugate base, A⁻.Reason
Stoichiometric neutralisation removes the original weak acid at equivalence.Working
The solution contains the salt supplying A⁻.Apply salt hydrolysis
Method
Show the conjugate base reacting with water to form hydroxide.Reason
The conjugate base of a weak acid accepts a proton from water.Working
A⁻ + H₂O ⇌ HA + OH⁻, so equivalence pH is above 7.
Guided practice 2
Choose phenolphthalein from curve position
Problem
Why is phenolphthalein, with a transition in the alkaline range, often suitable for a weak acid–strong base titration?
Try this before viewing the solution
Hints
Hint 1: locate equivalence
The conjugate-base salt makes the equivalence region alkaline.
Hint 2: indicator rule
A useful indicator completes its colour transition within the steep pH jump.
View solution step by step
Locate the rapid change
Method
Place the equivalence point above pH 7.Reason
The weak acid’s conjugate base hydrolyses at equivalence.
Working
The steep region extends into alkaline pH.
Match the transition
Method
Place phenolphthalein’s range within that steep region.
Reason
Only a small titrant-volume change then completes the colour change.
Working
Its end-point closely estimates the equivalence volume.
Common misconception 3
Separate equivalence from neutrality
Learner claim
Choose what fixes equivalence pH
View solution step by step
Define equivalence
Method
Use stoichiometric reacting amounts.Reason
Equivalence is an amount condition, not a pH definition.Working
Acid and base have reacted in the equation ratio.Inspect the resulting salt
Method
Consider hydrolysis of a weak partner’s conjugate.Reason
It can form H₃O⁺ or OH⁻ after neutralisation.Working
Strong acid–weak base is acidic; weak acid–strong base is alkaline; strong–strong is near 7 at 25°C.
Examiner practice 4
(curve interpretation)
Problem
An acid is titrated with NaOH(aq). The curve starts at pH 3.0 and has equivalence at pH 8.8. Identify the likely titration type and assess an indicator whose full transition range lies around pH 9 within the steep region. [4 marks]
Try this before viewing the solution
View solution step by step
Classify the acid
1 markMethod
Use the moderately acidic initial pH.Reason
A weak acid begins at a higher pH than an equal-concentration strong acid.
Working
The analyte is most consistent with a weak acid.
Classify the titrant
1 markMethod
Use the stated sodium hydroxide titrant.Reason
NaOH is a strong base under the lesson model.
Working
Weak acid–strong base titration.Use equivalence evidence
1 markMethod
Link pH 8.8 to conjugate-base hydrolysis.Reason
An alkaline equivalence point supports the classification.
Working
Equivalence above 7 is consistent.Assess the indicator
1 markMethod
Accept the pH-9 indicator because its full range lies in the steep region.
Reason
A small volume change carries it through the colour transition.
Working
The indicator is suitable.
Self-mark with the mark scheme
Compare your response with each mark point. Select a point only when your response contains that evidence.
Credit weak acid, strong base, alkaline-equivalence evidence and range-overlap decision.
Challenge 5
(half-equivalence link)
Problem
Try this before viewing the solution
Hints
Hint 1: equal components
Hint 2: invert pKa
View solution step by step
Use the buffer ratio
Method
Set the acid and conjugate-base concentrations equal.Reason
Half of the initial weak acid has been neutralised.Working
log ₁₀([A⁻]/[HA]) = log ₁₀(1) = 0.Read pKa
Method
Set pKₐ equal to the measured pH.Reason
The concentration-ratio term vanishes in Henderson–Hasselbalch.Working
pKₐ = 4.76.Convert to Ka
Method
Apply the inverse logarithm.Reason
pKₐ = - log ₁₀Kₐ.Working
Kₐ = 10^(-4.76) = 1.74 × 10⁻⁵.
Common Mistakes
- Saying “equivalence point = end-point” (they should be close, but are not identical).
- Choosing an indicator based only on “acid vs base” without considering strong/weak.
- Assuming the equivalence pH is always 7.
- Saying “pH = pKa at equivalence” (it is true at half-equivalence for weak acid–strong base).
Use the Aqueous Equilibria topic check to practise and check your understanding.
Exam Tips
- Always mention the indicator transition range relative to the steep region.
- For weak acid titration: mention buffer region and half-equivalence point (where pH = pKₐ).
- If a calculation is required at a point on the curve: do stoichiometry first (moles left), then decide whether it is strong acid/base, buffer, or salt hydrolysis.
Mind Stretchers
Mind stretcher 1Extension
Explain why a weak acid–weak base titration is hard to do accurately with an indicator.
Show Answer
Mark scheme:
- The pH change near equivalence is small (no steep vertical region).
- An indicator transition range cannot “fit” cleanly inside a sharp pH jump, so the end-point has a large uncertainty.
- Therefore a pH meter is preferred for this titration type.
Syllabus and review details
- GCE A-Level H2 Chemistry 9476-2027 · 9476-2027
9476 (2027), complete syllabus
Last reviewed: