Determining Speed of a Chemical Reaction
Measuring rate of reaction: time taken, gas volume and mass loss methods, plus interpreting graphs (gradient/tangent) in exam questions.
Continue where you stopped
The core idea
On this page
Learning objectives
- suggest a suitable method for investigating the effect of a given variable on the rate of a reaction
- interpret data obtained from experiments concerned with rate of reaction.
1. Definition
The rate (speed) of reaction is the change in amount of reactant used up or product formed per unit time.
To understand what “rate” looks like on graphs (gradient/tangent), revise: Speed of Reaction.
2. Key Ideas
- You must measure a quantity that changes with time (e.g. volume of gas, mass, time for a fixed change).
- Rate = gradient of the relevant graph:
- Volume of gas vs time → gradient is rate of gas production.
- Mass of mixture vs time (gas escapes) → gradient is rate of mass loss.
- A reaction is usually fastest at the start because reactant concentrations are greatest and any solid surface has not yet been depleted, so effective collisions are most frequent.
- When a graph becomes horizontal, the rate is zero (reaction has stopped / limiting reactant used up).
3. Detailed Explanations
- Rate is “change per time”: decide what changes (volume, mass, concentration, time for a fixed change).
- On a graph, rate = gradient; on a curve, rate at a specific time = tangent gradient.
- A horizontal graph means rate is zero (reaction stopped / limiting reactant used up).
- Fair test: change one factor only and keep the rest constant.
A. Method 1: Time taken for a fixed change
If you keep the amount of reactant the same each time (same mass/length/surface area), you can compare reactions by timing how long they take to reach a fixed end-point (e.g. “magnesium completely dissolves”).
Example reaction (magnesium + dilute sulphuric acid):
Mg(s) + H₂SO₄(aq) → MgSO₄(aq) + H₂(g)
Using 1/time gives a relative rate only when you are comparing similar experiments (same amount of reactant, same end-point). It is not the definition of rate.
At a fixed end-point, a shorter time means a faster reaction. Do not compare bubble size or make a rate conclusion from a single observation.
B. Method 2: Volume of gas produced vs time (gas syringe)
Use this method if the reaction produces a gas (e.g. marble + dilute hydrochloric acid).
CaCO₃(s) + 2HCl(aq) → CaCl₂(aq) + H₂O(l) + CO₂(g)
Swipe or scroll sideways to inspect the complete overview.
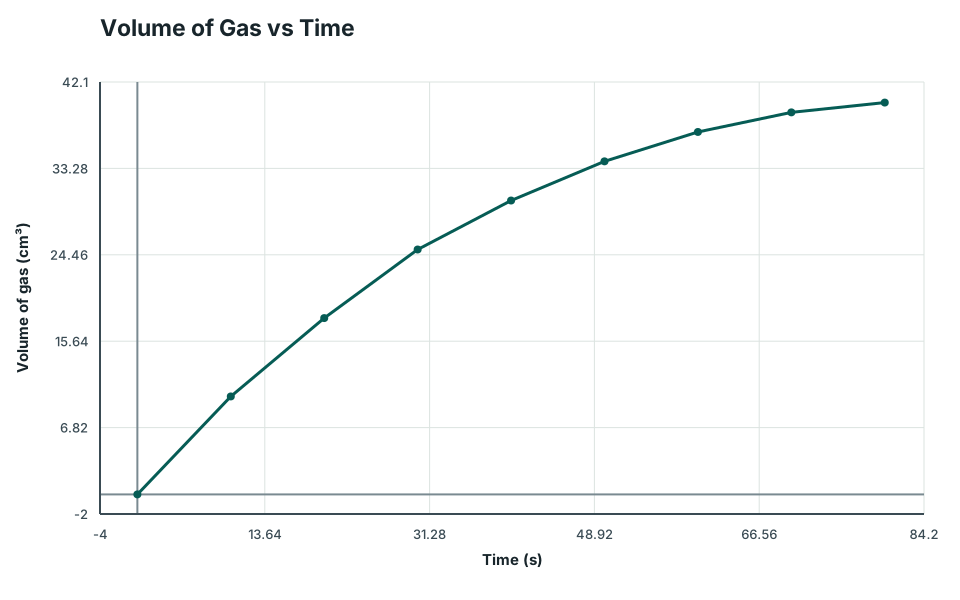
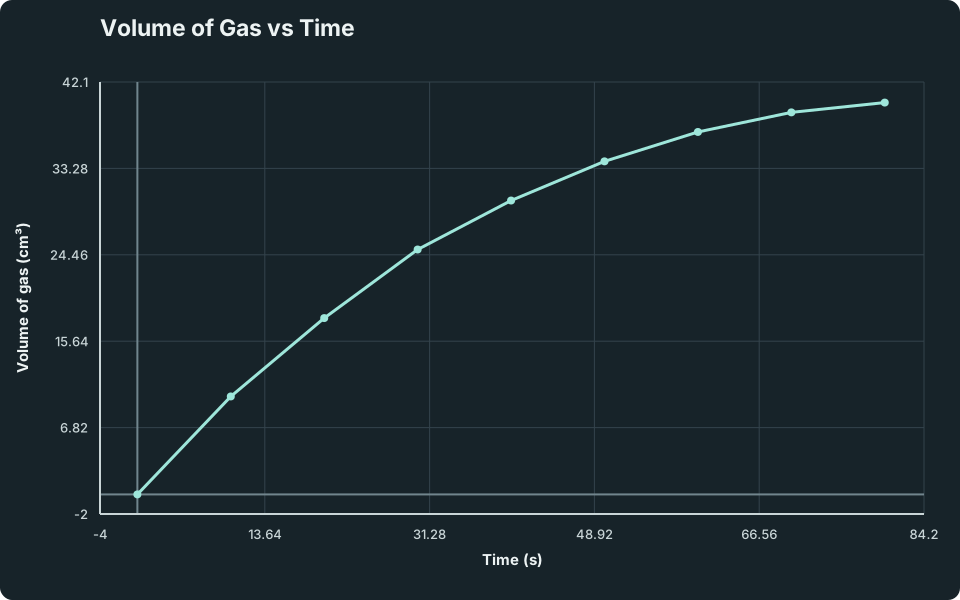
Plot a graph of volume of gas (e.g. CO₂) against time.
Volume of Gas vs Time
Example volume-of-gas vs time curve for a reaction that slows down as reactants are used up; gradient represents rate.
Scroll across the graph to read all labels.
View figure data
| Time (s) | CO2 produced |
|---|---|
| 0 | 0 |
| 10 | 10 |
| 20 | 18 |
| 30 | 25 |
| 40 | 30 |
| 50 | 34 |
| 60 | 37 |
| 70 | 39 |
| 80 | 40 |
If the graph is curved, the rate at a particular time is found by drawing a tangent and calculating its gradient. Do not use two random points on the curve unless the question asks for an average rate over that time interval.
C. Method 3: Mass loss vs time (gas escapes)
Use this method when a gas escapes from the reaction mixture. As gas leaves, the mass decreases.
Swipe or scroll sideways to inspect the complete overview.
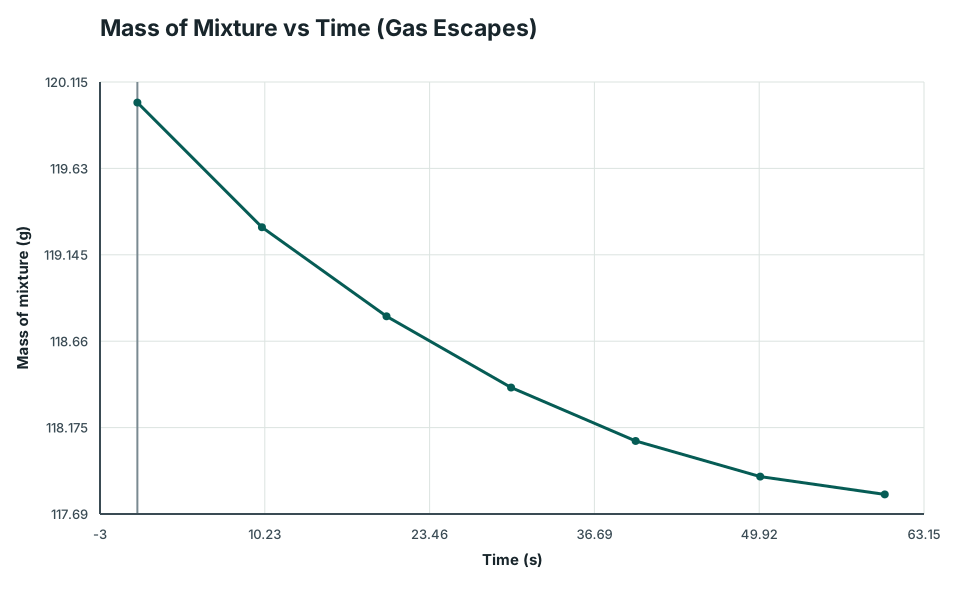
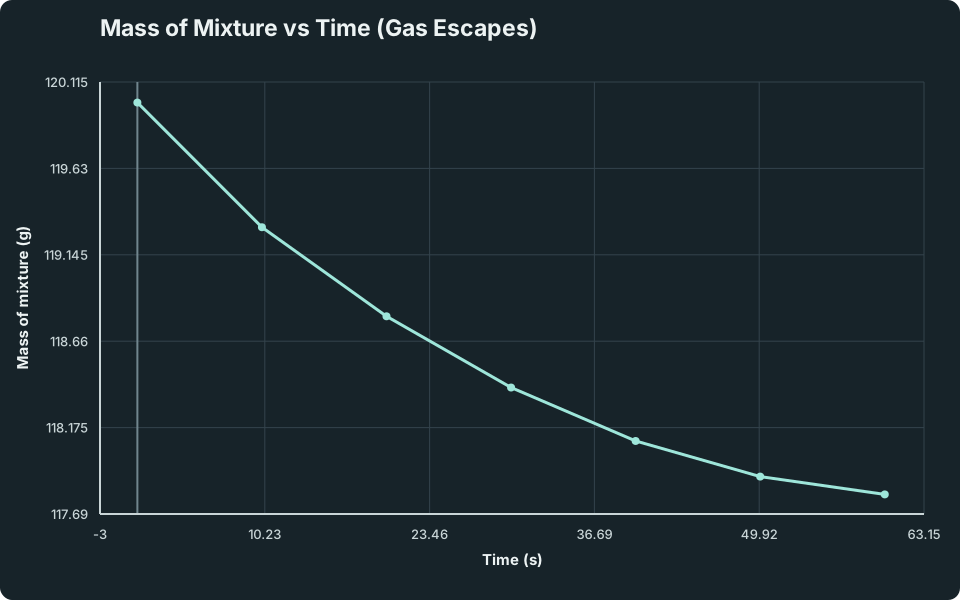
Plot a graph of mass against time.
Mass of Mixture vs Time (Gas Escapes)
Example mass vs time curve showing mass decreases as gas escapes; the magnitude of the negative gradient indicates rate.
Scroll across the graph to read all labels.
View figure data
| Time (s) | Mass |
|---|---|
| 0 | 120 |
| 10 | 119.3 |
| 20 | 118.8 |
| 30 | 118.4 |
| 40 | 118.1 |
| 50 | 117.9 |
| 60 | 117.8 |
Use dilute acids as instructed and keep your face away from the flask. Do not block the flask neck: gas must escape, or pressure can build up.
D. Choosing the best method (quick guide)
| Reaction feature | Best measurement | What you plot | What gives the rate |
|---|---|---|---|
| Gas is produced and you can collect it | Volume of gas | Volume vs time | Gradient (or tangent) |
| Gas is produced but collection is awkward | Mass loss | Mass vs time | Gradient (magnitude) |
| Reaction has a clear end-point (e.g. disappears, precipitate appears) | Time taken | N/A | 1/time for comparisons only |
- Macroscopic observation: gas volume rises quickly at first, then levels off.
- Particle explanation: reactant concentration falls as particles are used up, so effective collisions become less frequent.
- Symbolic representation: the gradient, Δ V/Δ t, decreases and finally becomes zero.
4. Common Mistakes
- Writing “faster reaction makes more gas” (wrong): the total gas depends on starting amounts; rate is about how fast gas is produced.
- Reading a curved graph by “joining two points on the curve” when the question wants the rate at a specific time (needs a tangent).
- Comparing times without controlling the amount/surface area of reactant (unfair test).
- Forgetting units (e.g. writing “0.8” instead of “0.8 cm³/s”).
5. Exam Tips
Use these exact ideas:
- “Rate is the gradient of the graph.”
- “The reaction is fastest at the start because there are more reactant particles, so there are more frequent effective collisions.”
- “When the graph becomes horizontal, the rate is zero (reaction has stopped).”
6. Worked Examples
Modelled example 1
Comparing rates using time
Problem
Study the worked solution
Check that the endpoint is comparable
Method
Use complete disappearance of identical magnesium pieces as the same fixed change.Reason
Time alone compares rate only when the experiments reach an equivalent endpoint with the same reactant amount.Working
Both trials use identical ribbon and the same endpoint.Compare the times
Method
Choose Acid A because it reaches the endpoint sooner.Reason
For the same change, a shorter time means a greater change per unit time.Working
25 s < 35 s, so A is faster.Confirm with relative rate
Method
Compare reciprocal times.Reason
1/t is a valid relative-rate tool for this controlled fixed endpoint.Working
A: 1/25 = 0.040 s⁻¹; B: 1/35 = 0.029 s⁻¹.
Guided practice 2
Average rate from data
Problem
Calculate change per elapsed time
Hints
Hint 1: average-rate relationship
View solution step by step
Divide change by interval
Method
Divide the 48 cm³ product increase by 60 s.Reason
An average rate spreads the measured change across the full stated interval.Working
48/60 = 0.80.Report the measured rate
Method
Give the gas-volume-per-time unit and two significant figures.Reason
The unit follows the axes and 48 cm³ has two significant figures.Working
0.80 cm³ s⁻¹.
Common misconception 3
Interpreting a gas-volume graph
Learner claim
Read gradient separately from amount
View solution step by step
Interpret the initial gradient
Method
Identify the start as the fastest section.Reason
Reactant concentrations and available solid surface are greatest initially, so effective collisions are most frequent.Working
Steep gradient ⇒ high gas-production rate.Explain the decreasing gradient
Method
State that rate falls as reactants are used up.Reason
Fewer available reactant particles produce fewer effective collisions per unit time.Working
The curve progressively becomes shallower.Separate final amount from rate
Method
Assign zero rate to the horizontal section.Reason
The graph may show the greatest accumulated gas volume while its gradient is zero because the limiting reactant is used up.Working
Horizontal line ⇒ no new gas ⇒ rate = 0.
Challenge 4
Instantaneous rate from a tangent
Graph-gradient transfer
Use two tangent points
Hints
Hint 1: point selection
Hint 2: gradient
View solution step by step
Find the tangent changes
Method
Subtract coordinates in the same order.Reason
The tangent gradient is change in gas volume divided by change in time.Working
Δ V = 34-18 = 16 cm³; Δ t = 50-10 = 40 s.Calculate the gradient
Method
Divide the volume change by the time change.Reason
The tangent represents the curve’s instantaneous slope at 30 s.Working
rate at 30 s = 16/40 = 0.40 cm³ s⁻¹.
7. Mind Stretchers
Mind stretcher 1: Tangent trapExtension
Question: A student finds the rate at 2 minutes by using the points (0 min, 0 cm³) and (4 min, 40 cm³) on a curved volume–time graph. Explain what this actually gives, and what they should do instead.
Show Answer
Answer:
- Using two points far apart gives an average rate over 0–4 minutes.
- To find the rate at 2 minutes, they must draw a tangent at 2 minutes and calculate the gradient of the tangent.
8. Quiz
The shared K324 / 6092 practice includes method selection, fair tests, graph gradients, tangents and rate calculations.
K324 / 6092 Practice