Activation Energy And Boltzmann Distribution
Learn and apply Activation Energy And Boltzmann Distribution in the published Chemistry course sequence.
Continue where you stopped
The core idea
On this page
Activation Energy and Boltzmann Distribution: Orientation
Temperature and catalysts are the two “rate boosters” examiners love to test. The mark-scheme phrases are very specific: you must talk about the fraction of molecules with E ≥ Eₐ and the area beyond Eₐ on a Maxwell–Boltzmann distribution.
Link this page to Rate Equations, Orders, and Rate Constant and the Reaction Kinetics hub to keep mechanism and data interpretation consistent.
Definitions (Must Know)
A. Activation energy, Eₐ
The activation energy, Eₐ, is the minimum energy required for reactant particles to react successfully (reach the transition state).
B. Successful collision
A successful collision is a collision with energy at least Eₐ (and correct orientation, where relevant).
C. Maxwell–Boltzmann distribution
A Maxwell–Boltzmann distribution shows how the energies of particles are distributed at a given temperature. The area under the curve represents the total number (or fraction) of particles.
D. Catalyst (in kinetics)
A catalyst increases reaction rate by providing an alternative pathway with a lower activation energy, Eₐ.
Detailed Explanations
A. What to say about the distribution
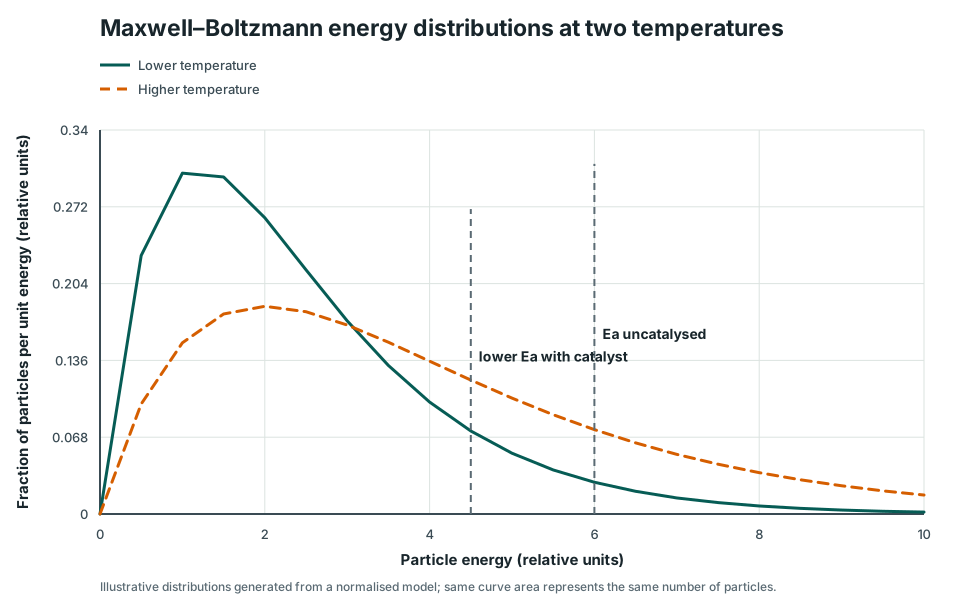
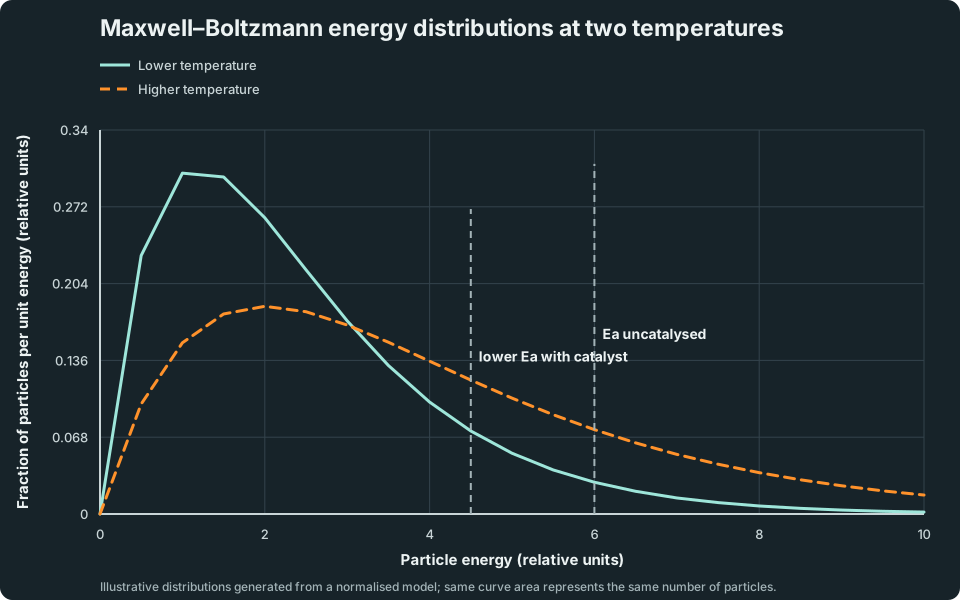
With higher temperature, the most probable energy moves to the right, the curve becomes broader and its peak becomes lower. The total area stays the same for the same number of particles, but the area beyond Eₐ increases.
Maxwell–Boltzmann energy distributions at two temperatures
A lower-temperature curve has a taller peak at lower energy. A higher-temperature curve is lower and broader. Uncatalysed and catalysed activation-energy thresholds mark the fractions energetic enough to react.
Scroll across the graph to read all labels.
View figure data
| Particle energy (relative units) | Lower temperature | Higher temperature |
|---|---|---|
| 0 | 0 | 0 |
| 0.5 | 0.2289 | 0.0974 |
| 1 | 0.3018 | 0.1516 |
| 1.5 | 0.2984 | 0.1771 |
| 2 | 0.2623 | 0.1839 |
| 2.5 | 0.2162 | 0.1791 |
| 3 | 0.171 | 0.1673 |
| 3.5 | 0.1315 | 0.1521 |
| 4 | 0.0991 | 0.1353 |
| 4.5 | 0.0735 | 0.1186 |
| 5 | 0.0538 | 0.1026 |
| 5.5 | 0.039 | 0.0879 |
| 6 | 0.0281 | 0.0747 |
| 6.5 | 0.0201 | 0.063 |
| 7 | 0.0142 | 0.0528 |
| 7.5 | 0.0101 | 0.0441 |
| 8 | 0.0071 | 0.0366 |
| 8.5 | 0.005 | 0.0303 |
| 9 | 0.0035 | 0.025 |
| 9.5 | 0.0024 | 0.0205 |
| 10 | 0.0017 | 0.0168 |
B. Why the area statement matters
Temperature does not increase every molecule’s energy by the same amount. Some particles lose energy in collisions while others gain it. The key change is that the fraction in the tail beyond Eₐ grows, so more particles are energetic enough to react.
C. Catalyst on the distribution
At the same temperature, the distribution curve stays the same, but the catalyst lowers Eₐ, so the “Eₐ line” moves left and the area beyond Eₐ increases.
Worked Examples
Modelled example 1
Explain the strong temperature effect on rate
Problem
Study the worked solution
Describe the energy distribution
Method
State that higher temperature shifts the distribution toward higher energies.Reason
Particle energies are redistributed rather than every particle receiving the same energy increase.Working
A larger fraction of particles lies in the high-energy tail.Compare with Ea
Method
Identify the increased area where E ≥ Eₐ.Reason
Those particles have enough energy for successful collisions.Working
Fraction with E ≥ Eₐ increases significantly.Link to rate
Method
State that successful collisions per unit time increase.Reason
The energetic-fraction effect can be much larger than the modest collision-frequency increase.Working
More successful collisions → faster reaction.
Guided practice 2
Describe a higher-temperature distribution
Problem
Try this before viewing the solution
Hints
Hint 1: describe the curve
Hint 2: preserve and partition area
View solution step by step
Describe the new curve
Method
State that the curve broadens, lowers and shifts toward higher energies.Reason
Higher temperature changes the spread and most probable particle energy.Working
Lower peak; broader curve; most probable energy further right.Track the relevant area
Method
State that the area beyond the fixed Eₐ line increases.Reason
A larger fraction of particles now has at least the activation energy.Working
Fraction with E ≥ Eₐ increases.Conclude
Method
Link that fraction to successful collisions per unit time.Reason
More collisions meet the energy requirement.Working
Successful-collision frequency and reaction rate increase.
Common misconception 3
Correct a temperature–Ea claim
Learner claim
Choose what changes
View solution step by step
Keep the threshold fixed
Method
State that Eₐ is unchanged when only temperature changes.Reason
The reaction pathway has not been replaced.Working
The Eₐ line stays in the same energy position.Change the distribution
Method
Broaden and lower the curve, shifting its most probable energy right.Reason
This increases the area beyond the unchanged threshold.Working
Larger fraction with E ≥ Eₐ → faster rate.
Examiner practice 4
Explain a catalyst on a Boltzmann diagram
Problem
Try this before viewing the solution
View solution step by step
Preserve the distribution
1 markMethod
State that the Maxwell–Boltzmann curve remains unchanged.Reason
Temperature and particle number are unchanged.Working
Same distribution curve.Lower the threshold
1 markMethod
Move the activation-energy line left.Reason
The catalyst provides an alternative pathway with lower Eₐ.Working
E_(a,cat) < E_(a,uncat).Increase successful fraction
1 markMethod
Identify the larger area beyond the lower threshold.Reason
More particles now meet the energy requirement.Working
Fraction with E ≥ E_(a,cat) increases.Link to rate
1 markMethod
State that successful collisions per unit time increase.Reason
A larger eligible fraction can react.Working
Reaction rate increases.
Self-mark with the mark scheme
Compare your response with each mark point. Select a point only when your response contains that evidence.
Credit the unchanged curve, lower Ea, larger energetic fraction and rate link.
Challenge 5
Separate cooling and catalyst effects
Problem
Try this before viewing the solution
Hints
Hint 1: separate curve and threshold
Hint 2: compare directions
View solution step by step
Analyse cooling
Method
Shift the distribution toward lower energies, making it narrower with a higher peak.Reason
A smaller fraction lies beyond the original Eₐ.Working
Cooling alone lowers the successful-collision fraction and rate.Analyse the catalyst
Method
Move the activation-energy threshold left without attributing that move to temperature.Reason
The alternative pathway has lower Eₐ.Working
Catalyst alone increases the fraction above the threshold and rate.Judge the combined outcome
Method
State that the two changes have opposing rate effects.Reason
The qualitative diagram does not quantify which change dominates.Working
The net rate change cannot be determined without further quantitative information.
Mind Stretchers
Mind stretcher 1Extension
Two reactions at the same temperature have different activation energies: E_(a,1) > E_(a,2). Without doing calculations, explain which reaction is faster and why, using Maxwell–Boltzmann language.
Show Hint
Temperature changes the distribution; a catalyst changes the threshold. Distinguish those two diagrams.
Show Answer
Mark scheme:
- For the lower Eₐ reaction (E_(a,2)), the Eₐ threshold is smaller.
- Therefore the area under the distribution curve with E ≥ Eₐ is larger.
- A larger fraction of molecules have enough energy for successful collisions, so the rate is higher.
Mind stretcher 2: Same rate increase, different causeExtension
Question. Two changes each increase rate. Change X moves the Eₐ line left without changing the distribution; change Y broadens and lowers the distribution peak while keeping Eₐ fixed. Identify each change and explain the larger successful fraction.
Show Hint
A catalyst changes the pathway. Temperature changes the particles’ energy distribution.
Show Answer
X is adding a catalyst: its alternative pathway has lower Eₐ. Y is increasing temperature: a larger area lies beyond the unchanged Eₐ. In both cases a larger fraction of collisions can overcome the activation barrier.