Calorimetry technique: measuring a temperature change
Key idea: Record temperature before and after mixing in an insulated cup. Extrapolate the later trend to mixing to estimate ΔT, then use the combined solution mass in q = mcΔT to find reaction heat.
Offline pages
Saved on this device only. Connect at least once every 30 days to confirm Premium. Sign-out or a change of account removes saved copies.
Loading guide controls…
Guided lessons · coming soon
Guided lesson
Guided steps
- Choose when to read the extended cooling line.
- Check starting temperatures, mixing and probe placement.
- Compare corrected and uncorrected temperature rises.
- Find the temperature at mixing and the corrected rise.
- Explain why continued reaction would spoil the correction.
- Use the combined mass and check omitted heat transfers.
- Calculate solution heat and evaluate the cup claim.
- Explain which heat transfer the correction still leaves out.
On this page
You stopped at:
ContinueIn calorimetry calculations, you use q = mcΔ T. This lesson asks how the measured Δ T is obtained and how well it represents the reaction.
The reaction changes the temperature of the solution while heat is also exchanged with the apparatus and the room. Good technique reduces these unwanted transfers; data analysis estimates some of what remains.
Check your understanding 1 Choose the time for the correction
Two solutions are mixed at 90 s. The highest reading occurs at 120 s; the reaction has finished by 150 s. To which time should the later cooling line be extended?
Show answer
Extend a suitable cooling-only line to 90 s. The maximum reading occurs after some cooling and sensor delay; it is not the time at which mixing began.
Make the temperature reading represent the whole solution
For a supervised solution-calorimetry experiment, use the insulated container specified in the method, supported securely in a beaker if appropriate. A loose cover reduces heat exchange while allowing access for the thermometer or probe. It must not make a pressure-tight vessel.
Measure the starting temperature of both solutions before mixing. If they begin at the same temperature, there is one clear initial baseline. If they differ, some of the observed change comes from bringing them to a common temperature, so simply choosing one starting reading is not justified.
Mix as instructed and stir consistently. Keep the sensing part immersed in the liquid rather than resting against a wall or the bottom. Otherwise it may report a local temperature instead of the mixed solution’s temperature. Record the mixing time and temperature readings at known intervals; a data logger can help with timing but cannot correct poor probe placement or calibration.
Acid–alkali mixtures may be corrosive and can become hot. Wear the specified eye protection, use the stated volumes and concentrations, and deal with splashes using the supervised laboratory procedure. An insulating cup is not suitable for every reaction or solvent.
Estimate the temperature at the mixing time
For a rapid exothermic reaction, the highest reading may occur after mixing, while the probe responds and heat is already escaping. Plotting temperature against time preserves information that a single “highest temperature” loses.
Estimate the temperature at mixing
Both solutions initially have temperature 25.0 °C. After mixing at 120 s, the highest recorded temperature is 31.5 °C at 150 s. The cooling readings from 180 to 300 s lie on a line whose extension reaches 31.7 °C at 120 s.
Scroll across the figure to read all labels.
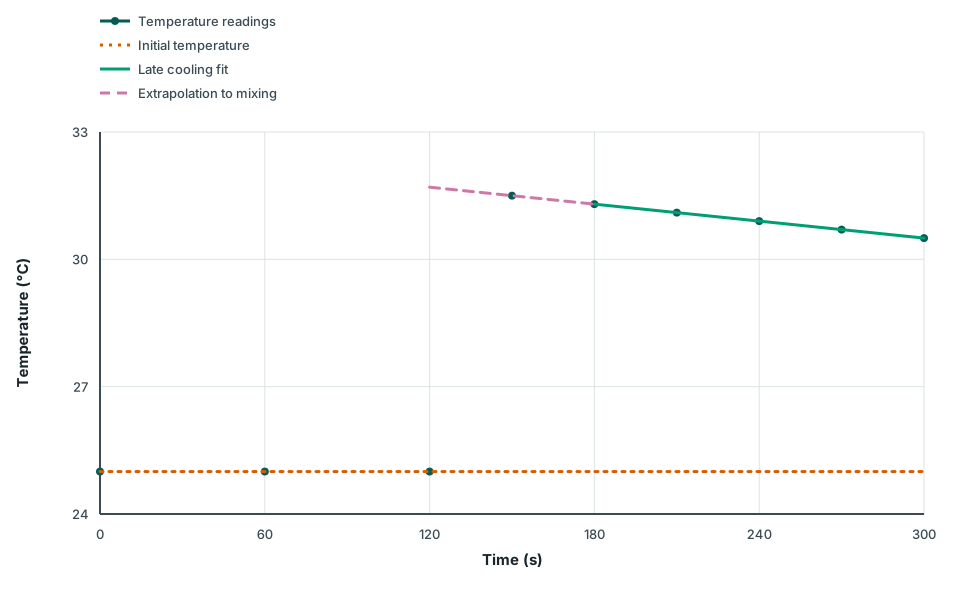
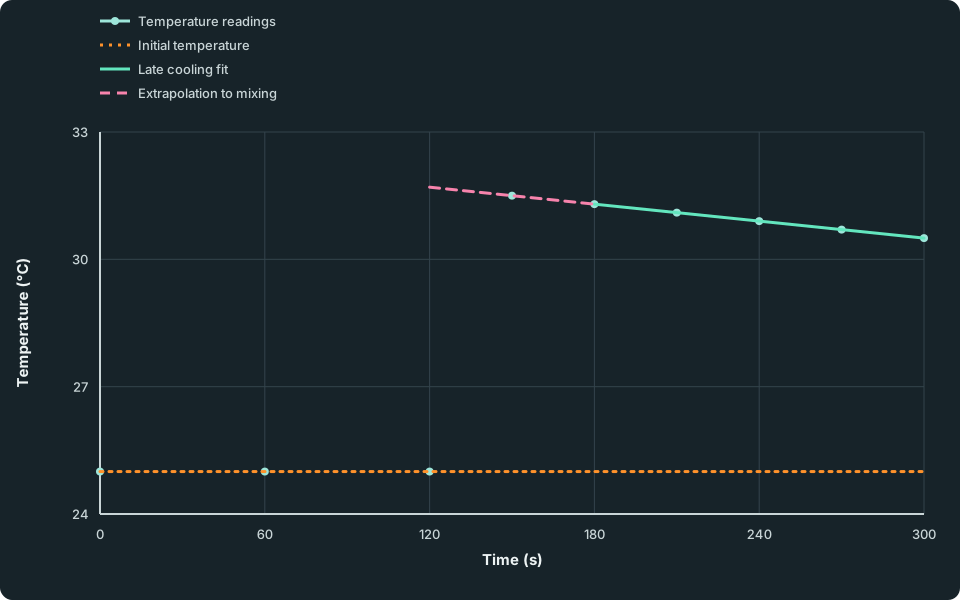
View figure data
| Series | Time (s) | Temperature (°C) |
|---|---|---|
| Temperature readings | 0 | 25.0 |
| Temperature readings | 60 | 25.0 |
| Temperature readings | 120 | 25.0 |
| Temperature readings | 150 | 31.5 |
| Temperature readings | 180 | 31.3 |
| Temperature readings | 210 | 31.1 |
| Temperature readings | 240 | 30.9 |
| Temperature readings | 270 | 30.7 |
| Temperature readings | 300 | 30.5 |
| Initial temperature | 0 | 25.0 |
| Initial temperature | 300 | 25.0 |
| Late cooling fit | 180 | 31.3 |
| Late cooling fit | 300 | 30.5 |
| Extrapolation to mixing | 120 | 31.7 |
| Extrapolation to mixing | 180 | 31.3 |
Worked example 1
Estimate a corrected temperature rise
Problem
Show full solution
Select the cooling-only line
Method
Use the fit through the readings after the reaction has finished.Reason
While the reaction is still releasing heat, the slope includes heat production as well as heat loss.Working
Answer
Use the cooling interval from 180 to 300 s.Read the line at mixing
Method
Extend that fit back to the mixing time of 120 s.Reason
The estimate allows for cooling before the maximum temperature was recorded.Working
Answer
Corrected temperature at mixing: 31.7 °C.Compare rises
Method
Subtract the initial temperature from each temperature estimate.Reason
A temperature difference has the same numerical value in kelvin and degrees Celsius.Working
Answer
Corrected: 31.7-25.0 = 6.7 K; maximum only: 31.5-25.0 = 6.5 K.State the corrected result
Working
Answer
The corrected rise is 6.7 K, 0.2 K greater than the uncorrected rise. It remains an estimate based on the cooling-line approximation.
Fit readings after the reaction is substantially complete. If the reaction is still releasing heat, the slope combines heat production with cooling and is not a cooling-only correction. A straight-line extension is a local approximation; do not extend it arbitrarily far back in time.
Check your understanding 2 Find the corrected rise from a new set of readings
Two solutions start at 24.0 °C and are mixed at 90 s. After a rapid reaction has finished, the temperature readings are:
| Time / s | Temperature / °C |
|---|---|
| 120 | 29.2 |
| 150 | 29.0 |
| 180 | 28.8 |
Estimate the temperature at mixing and the corrected temperature rise, both to one decimal place.
Show the steps Optional working
Show answer
The temperature falls by 0.2 °C every 30 s. Extending the line back from 120 s to 90 s gives 29.4 °C, so Δ T = 29.4-24.0 = 5.4 K.
Check your understanding 3 Why must the fitted interval be cooling only?
Explain why extending the temperature line from 120–180 s to the mixing time of 90 s requires the reaction to have finished throughout the fitted interval.
Show answer
The temperature falls by 0.2 °C every 30 s. Extending the line back from 120 s to 90 s gives 29.4 °C, so Δ T = 29.4-24.0 = 5.4 K. Continued reaction would add heat during the supposed cooling interval; its slope would not represent heat loss alone.
Connect the reading to the heat calculation
For two dilute aqueous solutions, the mass in mcΔ T is normally the combined solution mass, using measured masses or a stated density approximation. It is not just the mass of the reactant whose amount appears in the molar enthalpy calculation.
The assumptions have distinct effects:
| Assumption or limitation | What it means for the calculation |
|---|---|
| Solution density is approximated as 1.00 g cm⁻³ | Combined volume is used to estimate mass; this is not valid for every solution |
| Solution specific heat capacity is approximated as that of water | The stated c is an approximation to the mixture’s value |
| Apparatus heat capacity is neglected | Heat absorbed by the cup and probe is omitted, even after a cooling-curve correction |
| Heat exchange with the room is incompletely corrected | For an initially room-temperature, exothermic mixture, measured warming tends to be too small |
For an exothermic reaction under these conditions, omitted heat absorbed by the apparatus or lost to the room usually makes the calculated enthalpy less negative than the value being estimated. State the conditions when predicting an error direction; “heat loss always decreases temperature” is not a sound description of every experiment.
Keep the full temperature–time record, explain which interval you fitted, and state the mass and heat-capacity assumptions. These choices make the numerical result interpretable.
Check your understanding 4 Evaluate a corrected result
A rapid exothermic reaction warms 50.0 g of mixed solution from 22.00 °C to a corrected 27.00 °C. Take c = 4.18 J g⁻¹ K⁻¹. Find the heat absorbed by the solution in kJ to three significant figures. Evaluate the cup’s heat absorption in the following question.
Show the steps Optional working
Show answer
q = 50.0(4.18)(27.00-22.00) = 1045 J = 1.045 kJ, about 1.05 kJ.
Check your understanding 5 Show the heat calculation and assess the cup claim
For the 50.0 g solution warmed from 22.00 °C to 27.00 °C above, show the heat calculation. Explain whether extending the cooling line accounts for heat absorbed by the cup.
Show answer
q = 50.0(4.18)(27.00-22.00) = 1045 J = 1.045 kJ, about 1.05 kJ. The cup also warms and absorbs heat. Extending the cooling line does not add the cup’s heat capacity to mcΔ T; that would need a separate apparatus term.
Spotted an error? Report a correction
Syllabus and review details
- GCE A-Level H2 Chemistry 2027 · 9476-2027
9476 (2027), complete syllabus
Last reviewed: