Thermometric titration: finding the equivalence volume
Key idea: Record temperature against total titrant volume and intersect fitted trends on either side of the change. This estimates the equivalence volume, which gives reacting amounts from the equation ratio.
Offline pages
Saved on this device only. Connect at least once every 30 days to confirm Premium. Sign-out or a change of account removes saved copies.
Loading guide controls…
Guided lessons · coming soon
Guided lesson
Guided steps
On this page
You stopped at:
ContinueAn indicator titration detects a colour change. A thermometric titration follows temperature as titrant is added. For a suitable exothermic reaction, temperature rises while the added titrant reacts, then follows a different trend once the other reactant has been consumed.
Your target is the equivalence volume: the volume required by the reaction’s stoichiometry. This is different from the temperature–time correction in calorimetry technique.
Check your understanding 1 Choose the horizontal axis
To find the equivalence volume in a thermometric titration, which quantity belongs on the horizontal axis?
Show answer
Plot temperature against total delivered volume. The burette reading needs its initial reading subtracted; a temperature–time graph serves a different calorimetry calculation.
Build a temperature–volume record
For the supervised acid–alkali method, measure a fixed volume of alkali into an insulated container and record its starting temperature. Acid and alkali should begin at the same temperature for the simple interpretation below.
Add known small portions of acid from a burette, mix consistently and record the temperature after each addition using the same measurement procedure. Tabulate total acid volume added against temperature. Burette readings and delivered volume are different columns: volume added is the current reading minus the initial reading.
Choose smaller additions near the expected change in trend. Very large portions can pass over the equivalence region without enough data to locate it. Use a consistent timing procedure, since cooling between additions also changes the reading. Keep the probe immersed without touching the container.
Neutralisation does not make every mixture immediately safe. Use the stated concentrations and volumes, specified eye protection, and the supervised procedure for splashes and disposal.
Find the intersection, not just the warmest reading
Estimate equivalence between sampled volumes
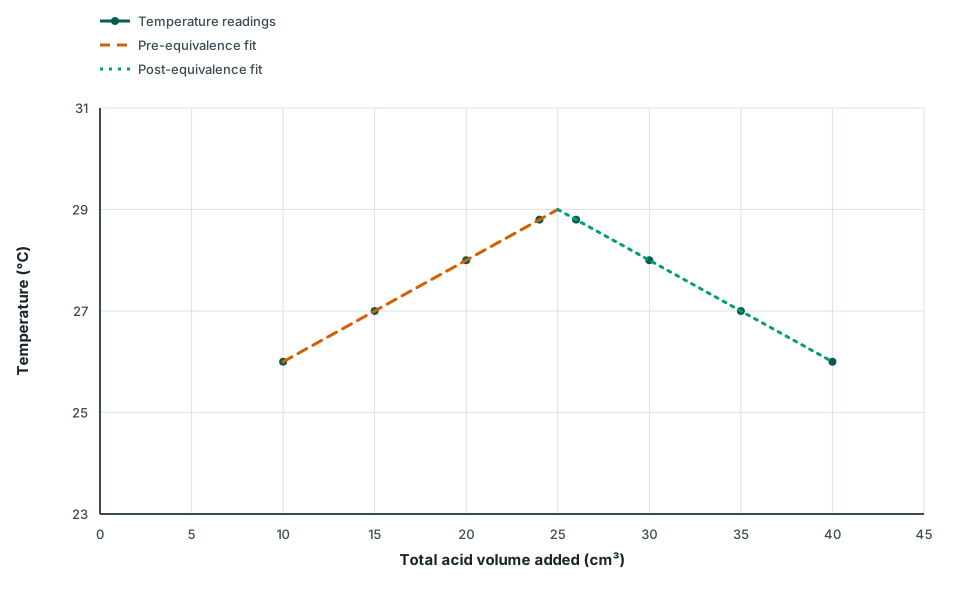
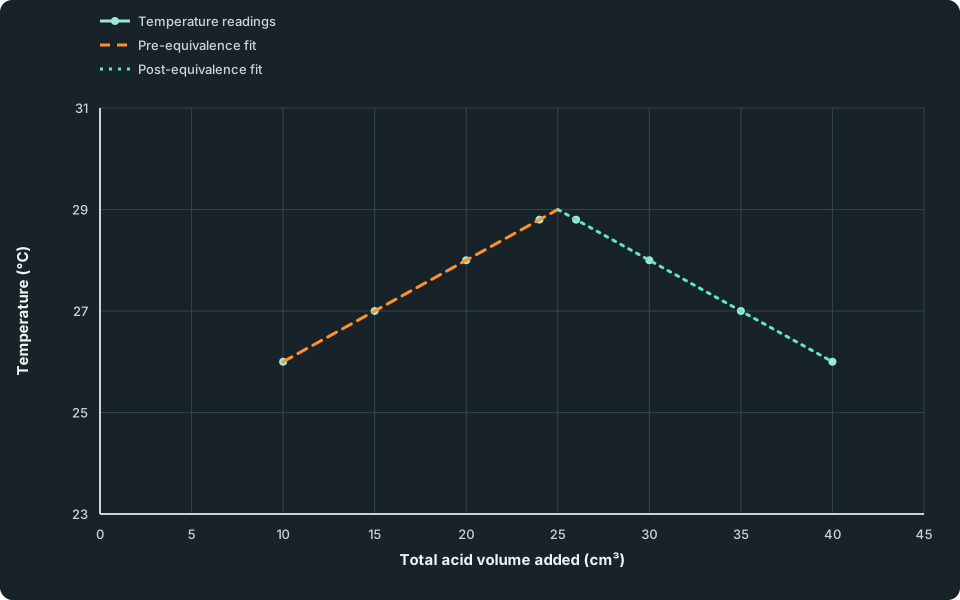
Temperature rises on the pre-equivalence branch and falls on the post-equivalence branch. Readings at 24 and 26 cm³ both give 28.8 °C, below the fitted intersection.
Scroll across the figure to read all labels.
View figure data
| Series | Total acid volume added (cm³) | Temperature (°C) |
|---|---|---|
| Temperature readings | 10 | 26.0 |
| Temperature readings | 15 | 27.0 |
| Temperature readings | 20 | 28.0 |
| Temperature readings | 24 | 28.8 |
| Temperature readings | 26 | 28.8 |
| Temperature readings | 30 | 28.0 |
| Temperature readings | 35 | 27.0 |
| Temperature readings | 40 | 26.0 |
| Pre-equivalence fit | 10 | 26.0 |
| Pre-equivalence fit | 25 | 29.0 |
| Post-equivalence fit | 25 | 29.0 |
| Post-equivalence fit | 40 | 26.0 |
These illustrative data show two local trends. Before equivalence, reaction releases heat as more acid is added. Beyond equivalence, further acid has no remaining alkali to neutralise; dilution, its initial temperature and heat exchange affect the temperature instead.
Fit appropriate approximately straight portions on either side and find their intersection. Here the lines meet at 25.0 cm³ and 29.0 °C. The warmest sampled readings, at 24.0 and 26.0 cm³, are both 28.8 °C: neither alone locates the equivalence volume.
The straight branches are a practical approximation. Heat loss, dilution effects, changing heat capacity, slow reaction or unequal starting temperatures can shift the observed trends. Do not assume every reaction has a temperature maximum at equivalence or that any two straight lines give a valid endpoint.
Worked example 1
Calculate alkali concentration from the graph
Problem
Show full solution
Read the reacting volume
Method
Use the branch intersection, 25.0 cm³.Reason
This estimates equivalence between the sampled points; using either warmest sample would choose a different volume without justification.Working
Answer
n(HCl) = 0.100 × 0.0250 = 0.00250 molApply the chemical ratio
Method
Use the balanced equation:
HCl + NaOH → NaCl + H₂OThen divide the alkali amount by its original volume.
Reason
The 1:1 equation connects acid amount to alkali amount. Concentration uses the alkali’s original measured volume, not the combined mixture volume.Working
Answer
c(NaOH) = 0.00250/0.0250 = 0.100 mol dm⁻³
Quick check
Check your understanding 2 Use a different acid and a numerical intersection
A different thermometric titration gives two fitted local branches: T = 21.0 + 0.300V and T = 30.0-0.150V, with T in °C and V the acid volume in cm³. The acid is 0.0500 mol dm⁻³ sulfuric acid; the original sodium hydroxide volume is 25.0 cm³. Assume complete neutralisation according to:
Find the equivalence volume and the alkali concentration.
Show the steps Optional working
Show answer
At the intersection, 21.0 + 0.300V = 30.0-0.150V, so 0.450V = 9.0 and V = 20.0 cm³. Acid amount is 0.0500 × 0.0200 = 0.00100 mol. The equation requires twice this amount of sodium hydroxide: 0.00200 mol. Therefore:
Assuming 1:1 would incorrectly halve the concentration.
Use the graph to determine a volume, then use the balanced equation to determine reacting amounts. Report the fit and its limitations separately from the stoichiometric calculation.
Spotted an error? Report a correction
Syllabus and review details
- GCE A-Level H2 Chemistry 2027 · 9476-2027
9476 (2027), complete syllabus
Last reviewed: