Tables, Graphs, Uncertainty
Learn and apply Tables, Graphs, Uncertainty in the published Chemistry course sequence.
Continue where you stopped
The core idea
On this page
Tables, Graphs and Uncertainty: Orientation
Data-handling marks are “free marks” if you follow the examiner rails: headings with units, sensible graphs, and uncertainty written in the correct language.
Use this with Paper 4 Skills: Planning, MMO, PDO, ACE and the Practical and QA (A Level) hub so method, data, and evaluation marks stay aligned.
Definitions (Must Know)
A. Accuracy
Accuracy is how close a measured value is to the true value (or accepted value).
B. Precision
Precision is how close repeated measurements are to each other (how much they scatter).
C. Reliability
Reliability is the consistency of measurements (often improved by repeats and a small spread).
D. Absolute uncertainty
Absolute uncertainty is the ± value in the same unit as the measurement (e.g. ±0.10 cm³).
E. Percentage uncertainty
The percentage uncertainty is: percentage uncertainty = (absolute uncertainty)/(measured value) × 100%
Detailed Explanations
A. Workflow: build a table that earns marks
- Decide your independent variable (IV) and dependent variable (DV).
- Make headings in the form quantity / unit.
- Keep decimal places consistent within a column (match the instrument resolution).
- Put repeats in separate columns (or rows), then add a mean (if required).
Mini example (headings):
- Concentration of HCl(aq) / mol dm⁻³
- Time for cross to disappear / s
Avoid:
- putting units inside every cell (units belong in the heading)
- mixed precision (e.g. 2.0, 2.13, 2.134 in the same column)
B. Workflow: draw a graph and read a gradient
- Put IV on the x-axis and DV on the y-axis.
- Label each axis with quantity and unit.
- Choose a scale that uses at least half the grid.
- Plot points accurately (small crosses).
- Draw one best-fit line/curve (not dot-to-dot).
- If asked for a gradient, choose two well-separated points on the best-fit line and include units.
Mini example (gradient sentence):
- “Gradient = 0.82 cm³ s⁻¹ (from two points on the line of best fit).”
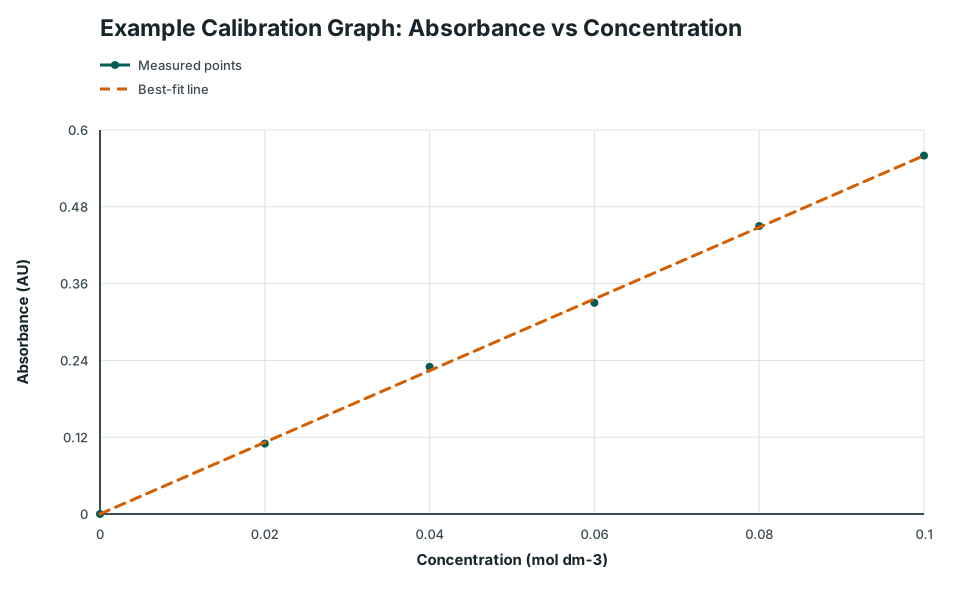
Example Calibration Graph: Absorbance vs Concentration
Example Calibration Graph: Absorbance vs Concentration. Measured points, Best-fit line plotted as Absorbance against Concentration.
Scroll across the graph to read all labels.
View figure data
| Series | Concentration (mol dm-3) | Concentration uncertainty | Absorbance (AU) | Absorbance uncertainty |
|---|---|---|---|---|
| Measured points | 0 | 0 | ||
| Measured points | 0.02 | 0.11 | ||
| Measured points | 0.04 | 0.23 | ||
| Measured points | 0.06 | 0.33 | ||
| Measured points | 0.08 | 0.45 | ||
| Measured points | 0.1 | 0.56 | ||
| Best-fit line | 0 | 0 | ||
| Best-fit line | 0.1 | 0.56 |
C. Workflow: write uncertainty correctly
- Take the uncertainty value from the question if given (use that).
- If not given, use instrument resolution rules (e.g. burette reading uncertainty per reading).
- Convert to percentage uncertainty when comparing or combining measurements.
Because a titre uses two burette readings, therefore its absolute uncertainty is the sum of the reading uncertainties.
- burette reading: often ±0.05 cm³ per reading (titre uses two readings)
- balance: usually ±(resolution) (e.g. ±0.01 g)
- stopwatch: depends on reaction speed; use the value given if provided
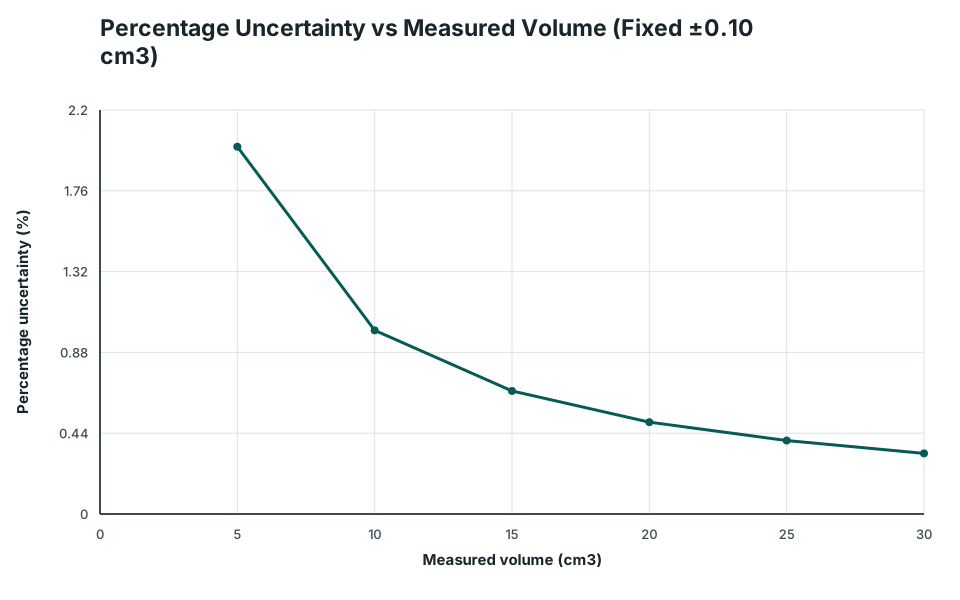
Percentage Uncertainty vs Measured Volume (Fixed ±0.10 cm3)
Percentage Uncertainty vs Measured Volume (Fixed ±0.10 cm3). ±0.10 cm3 plotted as Percentage uncertainty against Measured volume.
Scroll across the graph to read all labels.
View figure data
| Measured volume (cm3) | ±0.10 cm3 |
|---|---|
| 5 | 2 |
| 10 | 1 |
| 15 | 0.67 |
| 20 | 0.5 |
| 25 | 0.4 |
| 30 | 0.33 |
D. Combining uncertainties (simple approach)
- For sums/differences: add absolute uncertainties.
- For products/quotients: add percentage uncertainties.
Worked Examples
Modelled example 1
Find the Absolute Uncertainty in a Titre
Problem
Study the worked solution
Identify the operation
Method
Write the titre as final reading minus initial reading.Reason
A delivered volume depends on two separate burette readings.Working
Vₜᵢₜᵣₑ = V_f-Vᵢ.Combine absolute uncertainties
Method
Add the two reading uncertainties.Reason
For a difference, absolute uncertainties add rather than cancel.Working
0.05 + 0.05 = ±0.10 cm³.
Guided practice 2
Convert Mass Uncertainty to a Percentage
Problem
Try this before viewing the solution
Hints
Hint 1: fraction
Hint 2: percentage
View solution step by step
Use the balance resolution
Method
Take the absolute uncertainty as ±0.01 g.Reason
The question supplies the resolution to use for this estimate.Working
Δ m = 0.01 g.Form a percentage
Method
Divide by the measured mass and multiply by 100.Reason
Percentage uncertainty expresses the uncertainty relative to the size of the measurement.Working
0.01/1.24 × 100% = 0.81%.
Common misconception 3
Correct an Unreliable Gradient Method
Learner method
Try this before viewing the solution
View solution step by step
Represent the trend
Method
Draw one appropriate line or curve of best fit rather than connecting every fluctuation.Reason
Scatter reflects experimental variation; dot-to-dot segments overinterpret it.Working
Use all plotted evidence to judge the best fit.Construct a large triangle
Method
Choose two well-separated points on the best-fit line and calculate Δ y/Δ x with units.Reason
A large change in each axis reduces the fractional effect of coordinate-reading uncertainty.Working
Gradient points need not be original data points.
Examiner practice 4
Audit a Results Table
Examination question
Try this before viewing the solution
View solution step by step
Correct headings
2 marksMethod
Use headings in quantity/unit form: “temperature / °C” and “time / s”.Reason
A heading must identify both the measured quantity and its unit without putting units in data cells.Working
Temperature / °C; time / s.Correct data structure
2 marksMethod
Use consistent decimal places within the temperature column and give each repeat its own column, followed by a mean column if required.Reason
Precision should match the instrument, and separate repeats keep the evidence checkable.Working
Trial 1 / s | Trial 2 / s | Trial 3 / s | Mean time / s.
Self-mark with the mark scheme
Compare your response with each mark point. Select a point only when your response contains that evidence.
Self-mark four independent presentation corrections.
Challenge 5
Find the Uncertainty in a Mass Loss
Uncertainty transfer
Try this before viewing the solution
Hints
Hint 1: difference
Hint 2: two readings
View solution step by step
Calculate the difference
Method
Subtract the final mass from the initial mass.Reason
The escaping product accounts for the decrease in measured mass.Working
18.46-18.11 = 0.35 g.Combine reading uncertainties
Method
Add the two balance-reading uncertainties.Reason
The calculated difference depends on both measurements.Working
Δ m = 0.01 + 0.01 = 0.02 g.Express relative uncertainty
Method
Divide the absolute uncertainty by the mass loss and multiply by 100.Reason
The relevant measured result is the 0.35 g difference, not either flask mass.Working
0.02/0.35 × 100% = 5.71%.
Mind Stretchers
Mind stretcher 1Extension
A student measures a gas volume as 24.6 cm³ with an absolute uncertainty of ±0.2 cm³. The time taken is 12.4 s with an absolute uncertainty of ±0.2 s. The student calculates the rate as V/t. Find the rate and the percentage uncertainty in the rate.
Show Hint
Use the uncertainty of the difference between two readings, then compare percentage rather than absolute uncertainty.
Show Answer
Mark scheme:
- Rate = 24.6/12.4 = 1.98 cm³ s⁻¹ (3 s.f.).
- Percentage uncertainty in V = 0.2/24.6 × 100% = 0.81%.
- Percentage uncertainty in t = 0.2/12.4 × 100% = 1.61%.
- For a quotient, add percentage uncertainties: 0.81 + 1.61 = 2.42%.
Mind stretcher 2: Choosing the more precise experimental designExtension
Question. Method A uses two burette readings to obtain 5.00 cm³; Method B uses the same burette to obtain 25.00 cm³. Each reading has uncertainty ±0.05 cm³. Compare the percentage uncertainty in the delivered volumes and recommend a method.
Show Hint
Use the uncertainty of the difference between two readings, then compare percentage rather than absolute uncertainty.
Show Answer
A delivered volume uses two readings, so its absolute uncertainty is ±0.10 cm³. Method A has 0.10/5.00 × 100 = 2.0% uncertainty; Method B has 0.10/25.00 × 100 = 0.40%. Method B is more precise because the same absolute reading uncertainty is a smaller fraction of the measured volume.