Concentration–Time Graphs and Half-life
Learn and apply Concentration–Time Graphs and Half-life in the published Chemistry course sequence.
Continue where you stopped
The core idea
On this page
Concentration–Time Graphs and Half-life: Orientation
Concentration–time questions test whether you can recognise order and extract half-life from a graph. This lesson uses the graphical signature checks required by 9476 without integrated rate equations.
Link this page to Rate Equations, Orders, and Rate Constant and the Reaction Kinetics hub to keep mechanism and data interpretation consistent.
Definitions (Must Know)
A. Half-life, t_(1/2)
The half-life, t_(1/2), is the time taken for the concentration of a reactant to fall to half its value.
B. First-order reaction
A first-order reaction has rate proportional to concentration: rate = k[A]
C. Zero-order reaction
A zero-order reaction has rate independent of concentration: rate = k
D. Prescribed graphical boundary
Use concentration–time data to compare successive halving intervals. A constant half-life supports first-order behaviour. Integrated rate equations, logarithmic plots and formulae derived from them are explicitly not required by 9476.
Detailed Explanations
A. Recognising order from graph shape
Concentration–Time Graphs: Zero vs First Order (Example)
Concentration–Time Graphs: Zero vs First Order (Example). Zero order (linear), First order (curved) plotted as Concentration of A against Time, t.
Scroll across the graph to read all labels.
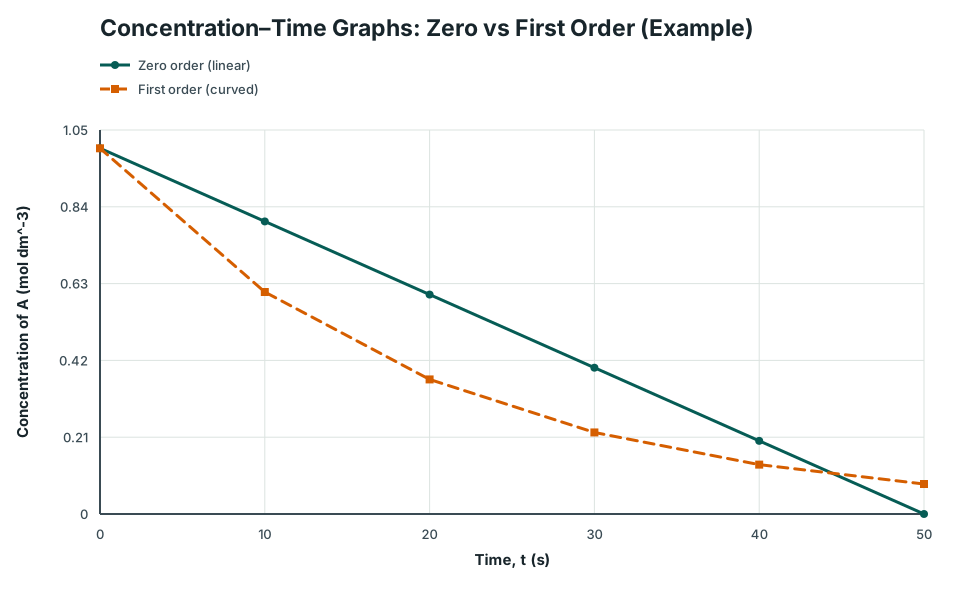
View figure data
| Time, t (s) | Zero order (linear) | First order (curved) |
|---|---|---|
| 0 | 1 | 1 |
| 10 | 0.8 | 0.607 |
| 20 | 0.6 | 0.368 |
| 30 | 0.4 | 0.223 |
| 40 | 0.2 | 0.135 |
| 50 | 0 | 0.082 |
B. Half-life method (from a concentration–time graph)
- Choose a concentration value and its half (e.g. 0.80 → 0.40).
- Read the times for those concentrations from the graph.
- The difference is one half-life.
- Repeat for another halving to check if the half-life stays the same (first-order signature).
C. Boundary check
Stop after identifying the order or reading a half-life when that is what the question asks. Do not calculate k from an integrated first-order relationship or transform the data into a logarithmic plot; those treatments are outside the explicit 9476 requirement.
Worked Examples
Modelled example 1
Identify first-order half-life evidence
Problem
Study the worked solution
Name the measured feature
Method
Compare successive concentration-halving intervals.Reason
Half-life is measured from one concentration to half that concentration, not always from time zero.Working
Each successive halving takes the same time.Infer the order
Method
Identify constant half-life as a first-order signature.Reason
For first-order behaviour, the same fraction is removed in equal time intervals.Working
The evidence supports first order in the reactant.
Guided practice 2
Read a half-life interval
Problem
Try this before viewing the solution
Hints
Hint 1: confirm the halving
Hint 2: use a time difference
View solution step by step
Locate the two times
Method
Use 10 s for 0.80 and 50 s for 0.40 mol dm⁻³.Reason
These are the endpoints of one concentration halving.Working
tₛₜₐᵣₜ = 10 s; t_end = 50 s.Calculate the interval
Method
Subtract the two graph times.Reason
Half-life is an elapsed time.Working
t_(1/2) = 50-10 = 40 s.
Common misconception 3
Correct a constant-rate claim
Learner claim
Compare amount changes
View solution step by step
Compare the decreases
Method
Calculate each absolute concentration change.Reason
Rate concerns amount or concentration change per unit time.Working
First decrease: 0.40; second decrease: 0.20 mol dm⁻³.Correct the interpretation
Method
State that equal times remove equal fractions, not equal concentration amounts.Reason
The smaller absolute decrease in the same time means the rate has fallen.Working
Constant half-life is compatible with a decreasing first-order rate.
Examiner practice 4
Reach one quarter by successive half-lives
Problem
Try this before viewing the solution
View solution step by step
Count halvings
1 markMethod
Write the fractional sequence from 1 to 1/4.Reason
Each first-order half-life halves the current concentration.Working
1 → 1/2 → 1/4: two half-lives.Apply the half-life
1 markMethod
Multiply 35 s by two intervals.Reason
The half-life is concentration-independent for first-order behaviour.Working
t = 2(35 s).State the result
1 markMethod
Complete the multiplication.Reason
The question asks for elapsed time from the initial value.Working
t = 70 s.
Self-mark with the mark scheme
Compare your response with each mark point. Select a point only when your response contains that evidence.
Credit the two-halving interpretation, multiplication and final time.
Challenge 5
Interpret a straight concentration–time trace
Problem
Try this before viewing the solution
Hints
Hint 1: compare equal-time changes
Hint 2: contrast fractional decreases
View solution step by step
Identify the graph signature
Method
Recognise the constant negative gradient.Reason
Equal concentration amounts are consumed in equal times.Working
The data support zero-order behaviour.Predict half-life behaviour
Method
State that successive half-lives become shorter as concentration falls.Reason
At constant gradient, halving a smaller concentration requires a smaller absolute decrease.Working
Zero order has constant rate/gradient, not constant half-life.
Mind Stretchers
Mind stretcher 1Extension
A reactant’s concentration falls from 0.80 to 0.40 mol dm⁻³ in 30 s, and from 0.40 to 0.20 mol dm⁻³ in 30 s. What order is supported, and what further graphical check would strengthen the conclusion?
Show Hint
Measure successive intervals for the same fractional decrease, rather than judging only the curve shape.
Show Answer
Mark scheme:
- The half-life is constant (30 s each halving), so first-order behaviour is supported.
- Check another successive halving interval on the concentration–time graph and account for graph-reading uncertainty.
Mind stretcher 2: Testing a half-life claimExtension
Question. A concentration falls from 0.80 to 0.40 mol dm⁻³ in 24 s and from 0.40 to 0.20 mol dm⁻³ in 25 s. What order is supported, and why is the one-second difference not fatal?
Show Hint
Experimental data have uncertainty; ask whether the two halving intervals are effectively constant.
Show Answer
The nearly constant successive half-lives support first-order behaviour. A small difference can arise from measurement and graph-reading uncertainty; the evidence is approximate, not mathematically exact.