Reading Reaction-Rate Graphs
Read gas-volume and mass-loss graphs, calculate average rates over intervals and estimate instantaneous rates using tangents.
On this page
A gas-volume graph records how much gas has collected at each time. Its height gives volume; its gradient tells you how quickly that volume is changing. Those are different readings. Use Measuring Reaction Rate if you need the practical methods behind these graphs.
Read a gas-volume graph
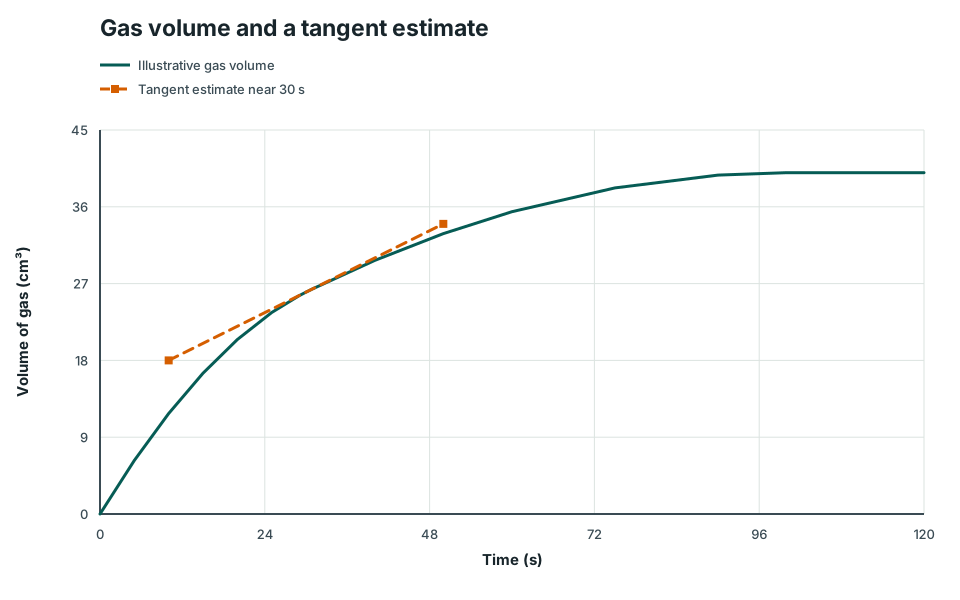
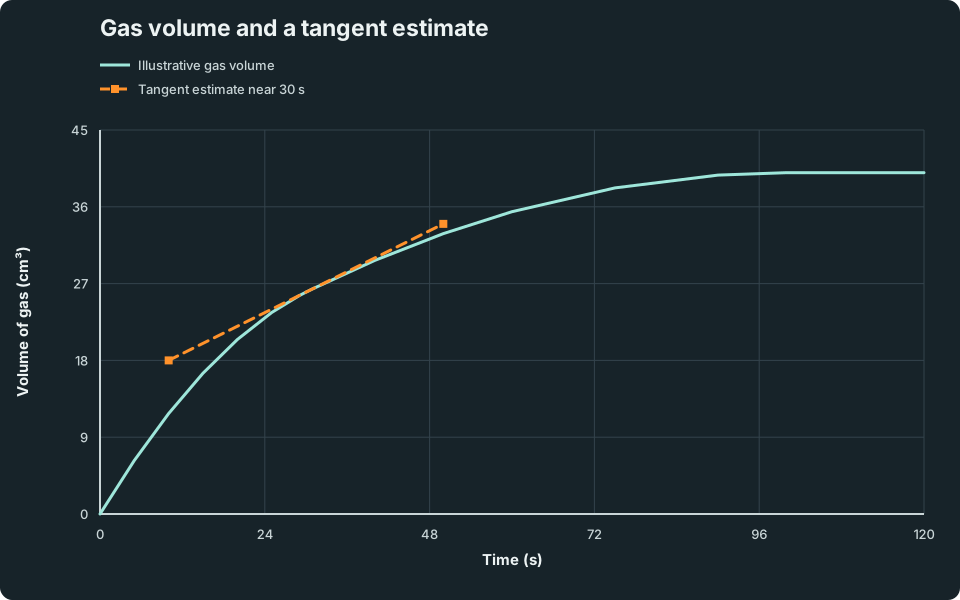
Gas volume and a tangent estimate
Illustrative gas volume rises and levels at 40 cubic centimetres. A dashed tangent estimate near 30 seconds passes through 10 seconds, 18 cubic centimetres and 50 seconds, 34 cubic centimetres.
Scroll across the graph to read all labels.
View figure data
| Series | Time (s) | Time uncertainty | Volume of gas (cm³) | Volume of gas uncertainty |
|---|---|---|---|---|
| Illustrative gas volume | 0 | 0 | ||
| Illustrative gas volume | 5 | 6.277778 | ||
| Illustrative gas volume | 10 | 11.777778 | ||
| Illustrative gas volume | 15 | 16.5 | ||
| Illustrative gas volume | 20 | 20.444444 | ||
| Illustrative gas volume | 25 | 23.611111 | ||
| Illustrative gas volume | 29 | 25.584444 | ||
| Illustrative gas volume | 30 | 26 | ||
| Illustrative gas volume | 31 | 26.397143 | ||
| Illustrative gas volume | 40 | 29.714286 | ||
| Illustrative gas volume | 50 | 32.857143 | ||
| Illustrative gas volume | 60 | 35.428571 | ||
| Illustrative gas volume | 75 | 38.214286 | ||
| Illustrative gas volume | 90 | 39.714286 | ||
| Illustrative gas volume | 100 | 40 | ||
| Illustrative gas volume | 110 | 40 | ||
| Illustrative gas volume | 120 | 40 | ||
| Tangent estimate near 30 s | 10 | 18 | ||
| Tangent estimate near 30 s | 50 | 34 |
The solid line joins constructed gas-volume data; it is an approximation to a smooth reaction curve. The dashed line is a supplied tangent estimate near 30 s. It is a construction line, not a second experiment, and its points need not lie on the reaction curve.
- A steep rising section means gas is forming quickly.
- A shallower rising section means a smaller gas-production rate.
- A horizontal plateau means no further gas is being collected. In the working, leak-free setup shown by this example, a reactant has been used up. The graph alone does not identify which one.
A reaction often slows as reactants are used up. In a solution–solid reaction, falling solution concentration or decreasing exposed solid surface can reduce the number of effective collisions per second. This is a common pattern, not a rule that every reaction must be fastest at its start.
Average rate over an interval
Read two points on the reaction curve at the beginning and end of the requested interval. Use both differences, even when the interval does not start at zero.
average rate = (V₂ - V₁)/(t₂ - t₁)
Instantaneous rate using a tangent
The rate at one time is the instantaneous rate. Draw a tangent to the curve at that time: a straight line that follows the curve’s local direction. Choose two well-separated points on the tangent, which need not be experimental data points, and calculate its gradient.
The tangent on the graph passes through (10 s, 18 cm³) and (50 s, 34 cm³). Its gradient estimates the rate at 30 s, not the average rate between 10 and 50 s on the reaction curve.
Run the gas-collection experiment and move the tangent along its volume–time curve to compare instantaneous rates.
0.20 g of marble as small chips in 20 cm³ of 1.00 mol/dm³ hydrochloric acid at 25 °C. After 0 s the gas syringe reads 0 cm³.
- Volume of gas
- 0 cm³
- Rate at the tangent
- — cm³/s
- Half-life
- — s
Try this
0 of 4 doneDuring a run, drag the tangent back to the start of the curve to find the initial rate. (not done yet)
The rate is the gradient of the volume–time graph. It is greatest at the start, when the reactants are most concentrated, and falls to zero.
Use two different acid concentrations, with the marble used up both times. (not done yet)
More concentrated acid gives a steeper curve: acid particles hit the marble more often. The final volume is the same, because the same mass of marble reacts.
Compare large chips with powder of the same mass. (not done yet)
Powder has a much larger surface area, so many more acid particles collide with the marble each second.
Decompose H₂O₂ with no MnO₂, then with some MnO₂. (not done yet)
MnO₂ gives the reaction a pathway with a lower activation energy. It is a catalyst: the same mass of MnO₂ is left at the end.
Your readings
| # | t / s | V / cm³ | Remove |
|---|---|---|---|
| No readings yet. Set up a measurement, then record it. | |||
Read a mass-loss graph
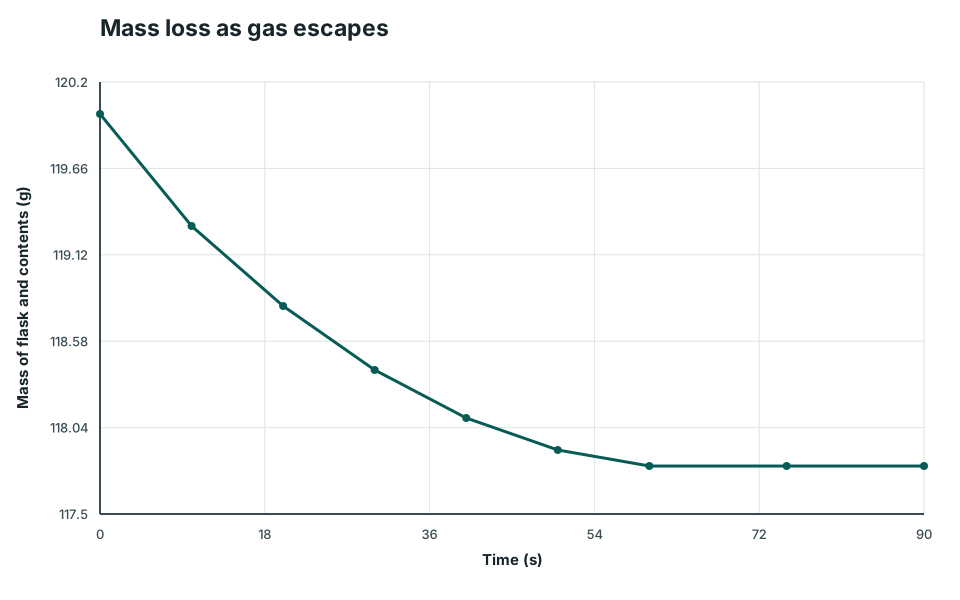
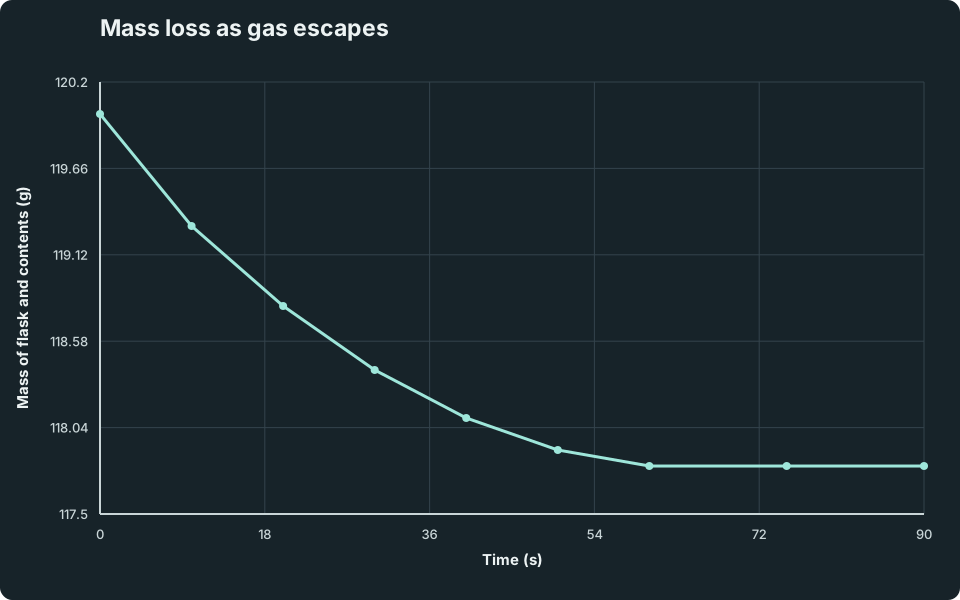
Mass loss as gas escapes
Illustrative total mass of a flask and contents decreases from 120.0 g to 117.8 g, then remains constant. The gradient is negative during gas loss and zero at the final plateau.
Scroll across the graph to read all labels.
View figure data
| Time (s) | Mass |
|---|---|
| 0 | 120 |
| 10 | 119.3 |
| 20 | 118.8 |
| 30 | 118.4 |
| 40 | 118.1 |
| 50 | 117.9 |
| 60 | 117.8 |
| 75 | 117.8 |
| 90 | 117.8 |
This is a different illustrative experiment: the balance records the mass of the flask and contents while gas escapes. The falling graph has a negative gradient. Quote the positive magnitude for the rate of mass loss.
average mass-loss rate = (m₁ - m₂)/(t₂ - t₁)
For example, between 10 s and 40 s, mass falls from 119.3 g to 118.1 g. The loss is 119.3 - 118.1 = 1.2 g over 40 - 10 = 30 s, giving 1.2/30 = 0.040 g s⁻¹. The graph gradient itself is −0.040 g s⁻¹.
Worked examples
Guided practice 1
Average rate from data
Problem
Calculate change per elapsed time
Hints
Hint 1: average-rate relationship
View solution step by step
Divide change by interval
Method
Divide the 32 cm³ increase by the 40 s interval.Reason
An average rate spreads the measured change across the full stated interval.Working
(44 - 12)/(60 - 20) = 32/40 = 0.80.Report the measured rate
Method
Give the gas-volume-per-time unit and two significant figures.Reason
The unit follows the measured volume and elapsed time.Working
0.80 cm³ s⁻¹.
Common misconception 2
Interpreting a gas-volume graph
Learner claim
Read gradient separately from amount
View solution step by step
Interpret the initial gradient
Method
Use the steepest section as the greatest gas-production rate in this example.Reason
Gradient gives the change per second. As reactants are used up in this example, the rate falls.Working
Steep gradient ⇒ high gas-production rate.Explain the decreasing gradient
Method
State that rate falls as reactants are used up.Reason
Fewer available reactant particles produce fewer effective collisions per unit time.Working
The curve progressively becomes shallower.Separate final amount from rate
Method
Assign zero rate to the horizontal section.Reason
At the plateau, accumulated gas volume is greatest but does not increase. In this working, leak-free setup, a reactant has been used up.Working
Horizontal line ⇒ no new gas ⇒ rate = 0.
Guided practice 3
Instantaneous rate from a tangent
Read the tangent
Use two tangent points
Hints
Hint 1: point selection
Hint 2: gradient
View solution step by step
Find the tangent changes
Method
Subtract coordinates in the same order.Reason
The tangent gradient is change in gas volume divided by change in time.Working
Δ V = 34-18 = 16 cm³; Δ t = 50-10 = 40 s.Calculate the gradient
Method
Divide the volume change by the time change.Reason
The tangent approximates the curve’s slope at 30 s.Working
rate at 30 s = 16/40 = 0.40 cm³ s⁻¹.
Try independently
Mind stretcher 1: Tangent trapExtension
Question: A student finds the rate at 2 minutes by using the points (0 min, 0 cm³) and (4 min, 40 cm³) on a curved volume–time graph. Explain what this actually gives, and what they should do instead.
Show Answer
Answer:
- Using two points far apart gives an average rate over 0–4 minutes.
- To find the rate at 2 minutes, they must draw a tangent at 2 minutes and calculate the gradient of the tangent.
Mind stretcher 2: Mass loss over a middle intervalExtension
In another gas-producing experiment, the recorded mass is 120.2 g at 15 s and 119.6 g at 35 s. Calculate the average rate of mass loss over this interval. State the sign of the mass–time graph’s gradient and explain why the rate of mass loss is quoted with a different sign.
Show Answer
Mass loss is 120.2 - 119.6 = 0.6 g in 35 - 15 = 20 s. The average rate of mass loss is 0.6/20 = 0.030 g s⁻¹. The graph’s gradient is negative, −0.030 g s⁻¹, because mass decreases. Rate of loss is quoted as the positive amount lost per second.
Use the Rate of Reactions topic check to practise graph interpretation and calculations.
Open the topic checkSyllabus and review details
- SEC G3 Pure Chemistry 2027 · 2027
Content structure and subject content, PDF pages 9–24
Last reviewed: