Measuring rate and reading rate data
Key idea: Measure reaction rate by recording gas volume or mass loss over time. A graph's gradient shows rate; its final plateau shows the total change, so faster does not mean more product.
Offline pages
Saved on this device only. Connect at least once every 30 days to confirm Premium. Sign-out or a change of account removes saved copies.
Loading guide controls…
Guided lessons · coming soon
Guided lesson
Guided steps
- Compare the time taken to make the same gas volume.
- Choose a measurement for cloudiness and what one run records.
- Calculate change divided by elapsed time, keeping the units.
- Calculate both averages and explain the unchanged final reading.
- Predict the final gas amount before viewing the curves.
- Compare the slopes and final heights of both curves.
- Use tangent points to find the initial rate.
- Calculate the mass-loss rate and final total gas loss.
- Calculate and compare mass-loss rates over both intervals.
- Check average rate and final gas amount separately.
- Calculate acid-loss rates and identify the reactant left.
- Explain equal initial slopes and unequal final heights.
- Compare average rates and decide whether the cause is known.
- Choose which repeat to investigate and explain your next steps.
On this page
You stopped at:
ContinueThe rate of a reaction is how fast a reactant is used up or a product forms. You measure it by following a change you can record over time, such as the volume of gas given off or the loss in mass, and you read it from the gradient of a graph.
Compare equal changes over different times
Check your understanding 1 Same change, different time
Two reactions each produce 20 cm³ of gas from a zero reading. Run A takes 30 s; run B takes 60 s. Before using a formula, decide which has the higher average rate over that interval.
Show answer
Calculate an average rate
The rate of reaction is the change in the amount of a reactant used up or product formed per unit time.
The unit depends on the measured quantity. Examples include cm³/s for gas volume and g/s for mass loss. You cannot measure “rate” directly: you measure a quantity that changes as the reaction goes, and time how fast it changes.
Choose a quantity and method
Pick a quantity that changes because of the reaction and that you can read repeatedly or at a fixed point.
- Gas syringe: record gas volume at regular time intervals.
- Mass loss: record the decrease in mass as a gaseous product escapes. Use cotton wool to reduce spray while allowing gas to leave.
- Fixed visual change: time how long a marked cross takes to disappear as a precipitate forms. Compare only experiments with the same end-point.
The first two methods give a reading every few seconds, so each run produces a curve. The cross method gives one time per run: the time to reach a fixed amount of cloudiness. A shorter time to the same end-point means a faster rate.
Guided practice 1
Choose a method for a precipitate reaction
Problem
Sodium thiosulfate solution reacts with dilute hydrochloric acid. A pale yellow precipitate of sulfur forms and the mixture slowly turns cloudy. Choose the most straightforward measurement here, and say what each run gives you.
Match the method to what changes
Hints
Hint 1
product
Which product can you see forming?
Hint 2
balance
A balance only shows a change when something leaves the flask.
Show solution step by step
Find what changes
Method
Follow the sulfur precipitate.Reason
It is the product you can see, and it stays in the flask.
Working
Answer
The mixture turns cloudy as sulfur forms.Choose the visible product
Method
Use sulfur cloudiness as the end-point.Reason
The reaction also produces sulfur dioxide, which is soluble in water. Its dissolution makes gas collection a less straightforward measure of progress than the visible cloudiness in this experiment.
Working
Answer
Use the visible sulfur cloudiness rather than relying on gas escaping.
State what the method gives
Working
Answer
Time how long the cross takes to disappear. Each run gives one time; the shorter time is the faster run, provided every run uses the same cross, flask and volume of mixture.
Quick check
Contrast this with marble chips and acid. Carbon dioxide escapes, so a gas syringe or a balance gives a whole curve for each run: you can see the rate at the start, how it slows and the final amount. The cross method gives one time per run. The thiosulfate experiment needs a supervised, ventilated procedure because sulfur dioxide is harmful.
Use readings at the start and end of an interval
Worked example 2
Calculate an average rate
Problem
Show full solution
Identify change and time
Method
Use the 36 cm³ product increase over 45 s.Reason
Reaction rate compares a measurable change with its elapsed time.Working
Answer
Change = 36 cm³; time = 45 s.Calculate and report
Method
Divide gas volume by time.Reason
The average is taken across the full stated interval.Working
Answer
36/45 = 0.80 cm³ s⁻¹.
Quick check
A reaction does not keep the same rate. Usually it is fastest at the start and slows as a reactant is used up. An average over the whole reaction hides this, so compare short intervals at different stages.
Magnesium ribbon reacts with excess dilute hydrochloric acid. Hydrogen is collected in a gas syringe.
| Time / s | 0 | 10 | 20 | 30 | 40 | 50 | 60 |
|---|---|---|---|---|---|---|---|
| Volume of hydrogen / cm³ | 0 | 18 | 30 | 38 | 43 | 45 | 45 |
Guided practice 3
Compare the start with later intervals
Problem
Use the hydrogen table. Calculate the average rate during 0–10 s and during 30–50 s, then say what happens during 50–60 s.
Work each interval
Show the steps Optional working
Hints
Hint 1
change
Subtract the reading at the start of the interval from the reading at its end.
Hint 2
time
30–50 s lasts 20 s, not 10 s.
Show solution step by step
Initial interval
Method
Use the readings at 0 s and 10 s.Reason
The first interval shows the rate near the start.Working
Answer
(18-0)cm³ ÷ 10s = 1.8cm³s⁻¹
Later interval
Method
Use the readings at 30 s and 50 s.Reason
Divide by the full 20 s so the two rates can be compared.
Working
Answer
(45-38)cm³ ÷ 20s = 0.35cm³s⁻¹
Interpret
Working
Answer
The rate falls from 1.8 to 0.35 cm³/s as the magnesium is used up. From 50 s the volume stays at 45 cm³: the rate is zero, and 45 cm³ is the total hydrogen made.
Quick check
Each 10 s interval adds less gas than the one before: 18, 12, 8, 5, 2 and then 0 cm³. The rate falls at every step, even though the volume keeps rising until 50 s.
Read rising and falling curves
Check your understanding 2 Does finishing sooner mean more gas?
Two runs completely react the same mass of magnesium with excess acid. One finishes sooner. Predict whether that run makes more hydrogen, less hydrogen or the same final amount, measured at the same temperature and pressure. Then compare with the curves below.
Show answer
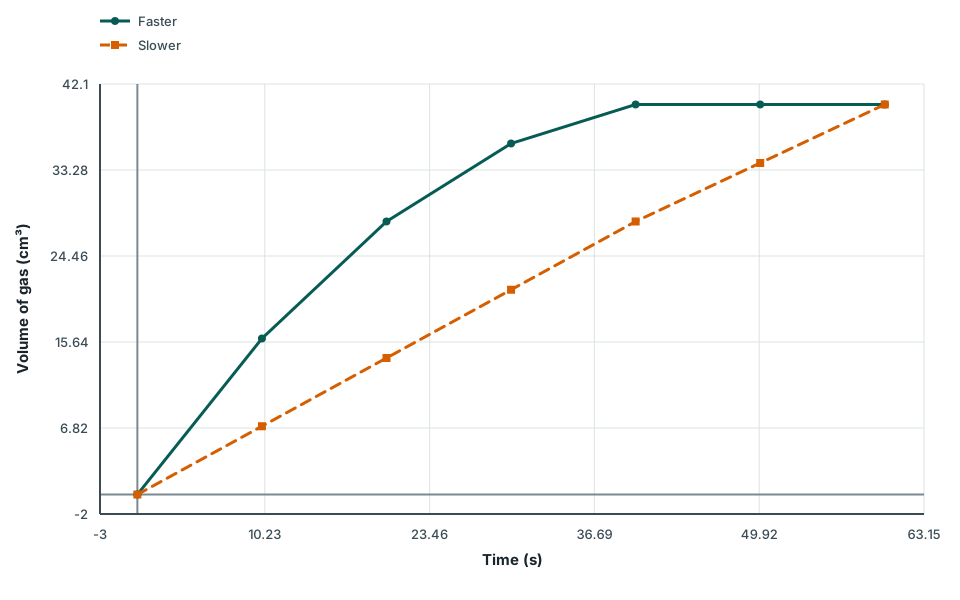
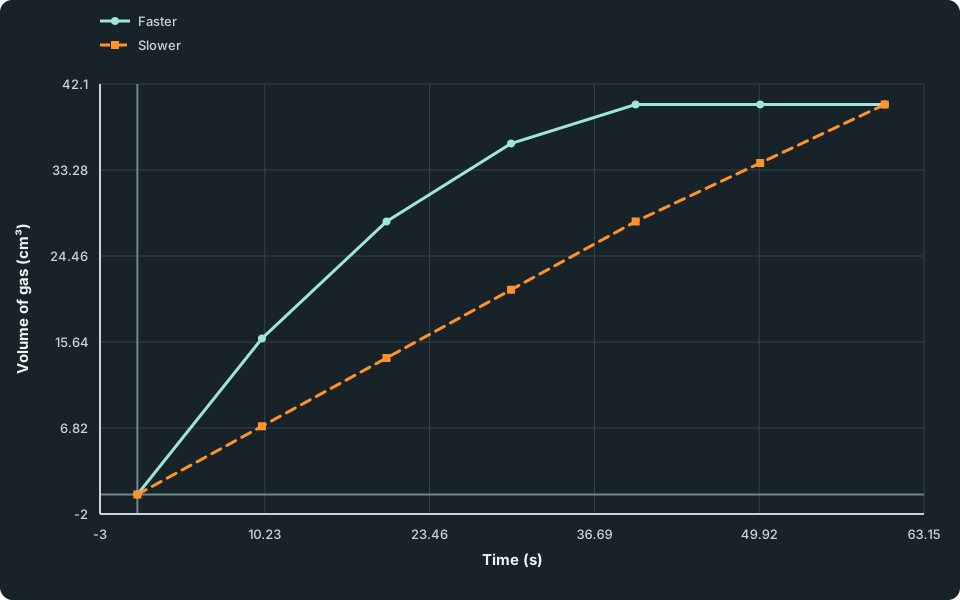
Compare gas-volume curves
Same final amount, different reaction rates
Two gas-volume against time curves. The faster reaction has the steeper initial gradient and reaches the same final volume earlier.
Scroll across the figure to read all labels.
View figure data
| Time (s) | Faster | Slower |
|---|---|---|
| 0 | 0 | 0 |
| 10 | 16 | 7 |
| 20 | 28 | 14 |
| 30 | 36 | 21 |
| 40 | 40 | 28 |
| 50 | 40 | 34 |
| 60 | 40 | 40 |
On a product-growth curve, such as gas volume against time, the gradient is the rate. A steeper curve is faster. When the curve becomes horizontal, no more product forms.
Estimate the initial rate with a tangent
The average rate over the first 10 s describes that whole interval. To estimate the rate at the start, draw a straight tangent that follows the curve’s direction at time zero. Choose two well-separated points on the tangent and divide its volume rise by its time interval. These points belong to the tangent; they need not lie on the reaction curve. The tangent’s gradient has units of cm³/s.
Check your understanding 3 Use points on the tangent
An initial tangent on a gas-volume curve passes through (0 s, 0 cm³) and (20 s, 40 cm³). The actual curve has reached only 30 cm³ at 20 s. Calculate the initial rate from the tangent and choose why you do not use 30 cm³ instead.
Show answer
Reading a falling trace
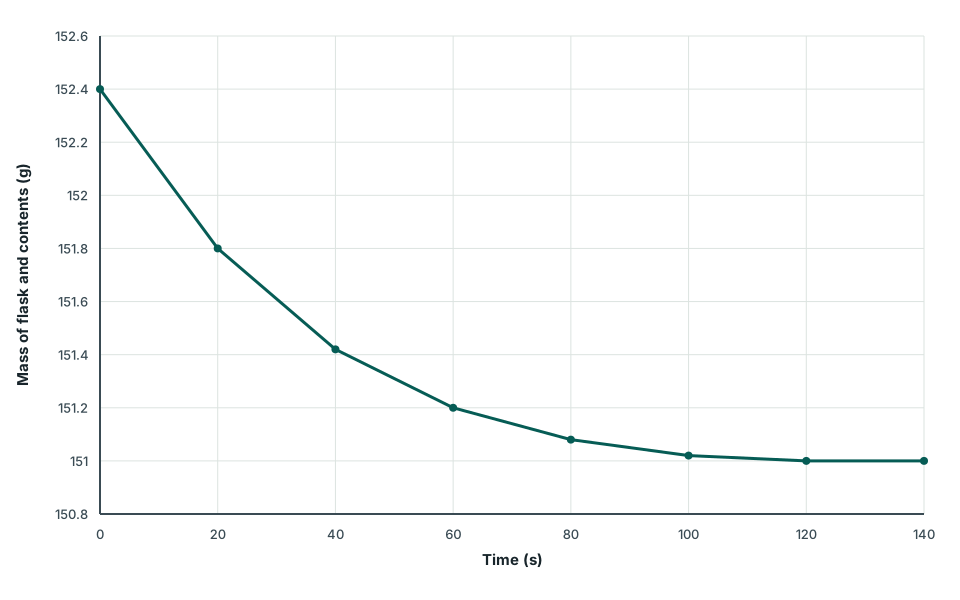
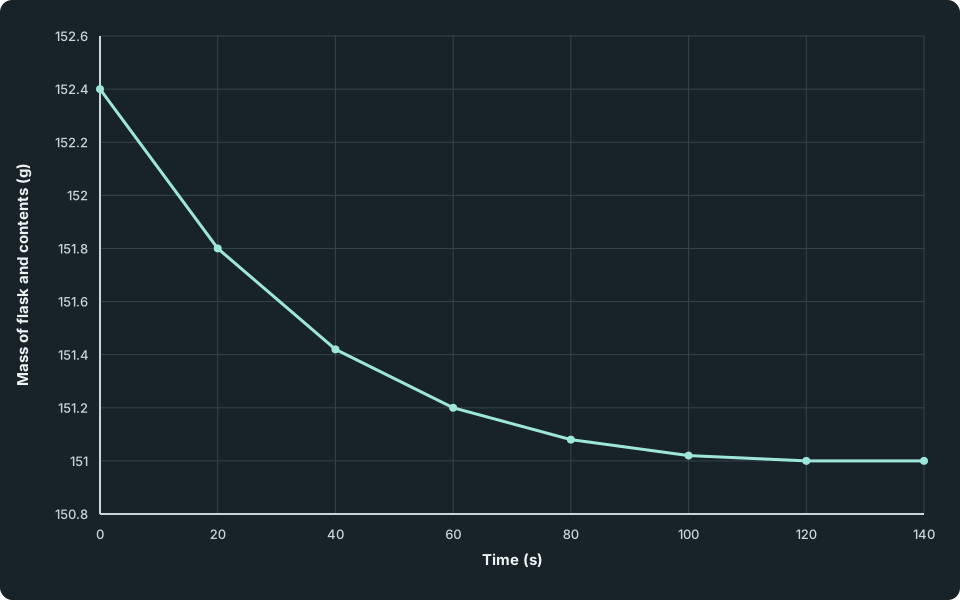
A reactant-loss trace slopes down because less reactant remains. A mass-loss experiment also slopes down, because gaseous product escapes from the apparatus. In both cases a steeper downward slope shows faster loss, but the rate of loss is normally reported as a positive amount lost per second. Subtract the later reading from the earlier one for that convention. A horizontal final section means no further measurable change; it does not mean that no product has formed.
Mass of flask and contents as carbon dioxide escapes
A falling curve of the mass of a flask and its contents against time from 0 to 140 s. The mass starts at 152.40 g, falls steeply at first, then more slowly, and stays at 151.00 g from 120 s.
Scroll across the figure to read all labels.
View figure data
| Time (s) | Mass (g) |
|---|---|
| 0 | 152.40 |
| 20 | 151.80 |
| 40 | 151.42 |
| 60 | 151.20 |
| 80 | 151.08 |
| 100 | 151.02 |
| 120 | 151.00 |
| 140 | 151.00 |
Worked example 4
Calculate a positive rate of mass loss
Problem
Marble chips react with acid in an open flask. Its mass falls from 152.40 g at 0 s to 151.80 g at 20 s. During 60–80 s it loses a further 0.10 g. From 120 s it stays at 151.00 g. Assume only carbon dioxide escapes. Compare the average loss rates over the two intervals and find the total gas mass lost.
Show full solution
Calculate the early loss rate
Method
Subtract the later mass from the earlier mass, then divide by elapsed time.
Reason
The trace falls, but the amount lost per second is reported as positive.
Working
Answer
(152.40-151.80)/20 = 0.030g/s.Use the later interval
Method
Divide the later mass loss by its 20 s interval.
Reason
A fair comparison uses change per second for each interval.
Working
Answer
0.10/(80-60) = 0.005g/s, one-sixth of the early rate.
Interpret the final reading
Working
Answer
The total carbon dioxide mass lost is 152.40-151.00 = 1.40g. From 120 s there is no further measurable loss: the rate is zero, not the accumulated gas mass.
A reactant-loss curve has the same falling shape. It levels off at zero if that reactant is used up. It levels off above zero if that reactant is in excess: the reaction stopped because the other reactant ran out.
Check your understanding 4 Compare intervals of different lengths
Only gas leaves a reacting flask. Balance readings are 84.6 g at 10 s, 84.2 g at 30 s and 83.9 g at 60 s. Calculate the positive average mass-loss rate for each interval before deciding which is faster.
Show the steps Optional working
Show the steps Optional working
Show answer
During 10–30 s, the loss is 84.6 − 84.2 = 0.4 g over 20 s, giving 0.020 g/s. During 30–60 s, the loss is 0.3 g over 30 s, giving 0.010 g/s. The earlier interval is faster. Compare changes per second, not the two mass changes alone, because the intervals have different lengths.
Separate rate from final amount
| Evidence | What it tells you |
|---|---|
| Steeper volume–time curve | More gas forms per unit time: a faster rate |
| Steeper downward flask-mass–time curve | Gas escapes more quickly: a faster rate |
| Same final volume, reached sooner | Faster rate, same final amount. The curves alone cannot tell you which factor was changed |
| Curve becomes horizontal | Rate is zero: a reactant has been used up or the reaction has effectively stopped |
The gradient shows the rate; the height at which the curve levels off shows the total amount of gas made. A steeper curve can finish at the same height.
Spot the mistake 5
Compare two curves
Learner claim
Read gradient and final height separately
Show solution step by step
Compare rates
Method
Compare average rates over each complete reaction.Reason
Curve A’s average rate over the full reaction is higher: 50 ÷ 40 = 1.25 cm³/s, compared with 50 ÷ 90 ≈ 0.56 cm³/s. Finishing times alone do not show the gradient at every moment.Working
Answer
A reaches 50 cm³ in 40 s; B takes 90 s.Compare final amounts
Method
State that both produce 50 cm³ in total.Reason
The final graph height represents accumulated product, not how quickly it formed.Working
Answer
Same final amount; different rates.
Common mistake
Check your interpretation
- Saying the faster experiment makes more product without checking the final graph value.
- Comparing times when the measured end-points are different.
- Comparing the changes in two intervals of different lengths without dividing each by its time.
- Reading a horizontal section as “no product formed” or “no reactant left”. It only means the quantity has stopped changing.
- Reporting a rate of mass loss as a negative number. Subtract the later mass from the earlier mass and give the loss per second.
Check your understanding 5 Read a reactant-loss table
2.0 g of marble chips react with 50 cm³ of dilute hydrochloric acid. Samples are taken to find the acid concentration at each time; their volume is negligible. The reaction runs to completion.
| Time / min | 0 | 1 | 2 | 3 | 4 | 6 | 8 |
|---|---|---|---|---|---|---|---|
| Acid concentration / mol/dm³ | 1.00 | 0.70 | 0.50 | 0.36 | 0.28 | 0.20 | 0.20 |
(a) Calculate the average rate of acid loss during 0–2 min and during 2–4 min. (b) The concentration stops at 0.20 mol/dm³, not zero. What does this show?
Show the steps Optional working
Show the steps Optional working
Show answer
(a) 0–2 min: (1.00 − 0.50) ÷ 2 = 0.25 mol/dm³ per minute. 2–4 min: (0.50 − 0.28) ÷ 2 = 0.11 mol/dm³ per minute. The reaction slows as the reactants are used up.
(b) The reaction stopped with acid left over, so the acid was in excess. The marble was used up. A horizontal section shows that nothing is changing, not that every reactant has gone.
Check your understanding 6 Same start, lower plateau
Two gas curves start with the same gradient. Curve A levels off at 60 cm³ and curve B at 30 cm³. Run B used half the volume of the same acid, with marble chips in excess in both runs. Compare the initial rates and the final amounts, and explain the final amounts.
Compare three points after answering: initial gradients, which reactant runs out, and why half its amount gives half the gas.
Show answer
The same initial gradient means the same initial rate. B makes half as much gas because it had half as much acid, the reactant that ran out. A lower plateau means less product, not a slower start.
Check your understanding 7 Separate rate from final amount
Experiment 1 gives 24 cm³ of gas in the first 12 s and levels off at 48 cm³. Experiment 2 gives 12 cm³ in the first 12 s and also levels off at 48 cm³. Calculate each average rate over the first 12 s. What can and cannot be concluded from the two curves?
Show answer
Experiment 1: 24 ÷ 12 = 2.0 cm³/s. Experiment 2: 12 ÷ 12 = 1.0 cm³/s. Experiment 1 has twice the average rate during 0–12 s, but both make 48 cm³, the same final amount of gas. The curves alone do not show which rate factor was changed.
Investigate unusual repeats
Repeats help you see how much the results vary. A time far from the others is a suspected anomaly: check the quantities, temperature, mixing and end-point, then repeat that condition. Exclude a result only with a reason, such as a recorded leak or timing error. Use the valid repeats to calculate a mean.
Check your understanding 8 Evaluate an anomalous repeat
Times for a cross to disappear are 42 s, 43 s and 71 s. Identify the anomaly and state the next step.
Compare your answer with the model: identify the unusual time, check the method and repeat before deciding whether to exclude it.
Show answer
71 s is anomalous because it is far from the two concordant values. Check whether the quantities, temperature, mixing and viewing end-point were controlled, repeat the condition, then calculate a mean from justified valid results.
Common mistakes
- Reading the rate from the height of a curve instead of its gradient.
- Leaving out the unit of rate, such as cm³/s.
- Using the reading at one time instead of the change over an interval for an average rate.
- Saying a faster reaction makes more product. With the same amounts, it makes the same amount sooner.
Spotted an error? Report a correction
Syllabus and review details
- SEC G3 Combined Science Chemistry component 2027 · 2027
Chemistry content structure and subject content, PDF pages 26–36
Last reviewed: