Rate measurements: continuous records and clock times
Key idea: Follow a reaction with an observable linked to progress. A tangent gives an instantaneous rate; time to the same small reaction extent gives a relative initial rate proportional to 1/t.
Offline pages
Saved on this device only. Connect at least once every 30 days to confirm Premium. Sign-out or a change of account removes saved copies.
Loading guide controls…
Guided lessons · coming soon
Guided lesson
Guided steps
- Check early gas collection and control the comparison.
- Calculate a tangent gradient with its axis units.
- Find the later volume increase and average rate.
- Explain why the later average differs from the initial rate.
- Convert Q’s rate to seconds before comparing.
- Explain what else a concentration-rate comparison would need.
- Use reciprocal times only for the same small extent.
- Calculate the rate ratio from the clock times.
- Explain why doubling the endpoint amount changes the comparison.
On this page
You stopped at:
ContinueYou cannot usually watch a concentration directly. Instead, you measure an observable that changes as the reaction proceeds: gas volume, mass, colour or another suitable signal. The method is useful only when you can explain how that signal relates to reaction progress.
This lesson develops the measurement behind initial-rate comparisons. It separates a continuous record, which gives a curve, from a clock measurement, which gives the time to a fixed small extent of reaction.
Start collection and timing together
For a gas-producing reaction, assemble and check the collection apparatus before starting. Use the instructed way to initiate the reaction without losing the early gas while fitting a stopper. A gas-tight connection and a freely moving syringe plunger matter especially for an initial rate: missed early data cannot be recovered from the final volume.
Keep the chosen independent variable separate from controls. When comparing concentration, hold temperature, total mixture volume and other relevant quantities constant. For a solid reactant, surface area also matters. Mix consistently; a changing mixing delay can imitate a rate change.
Choose a measurement interval and instrument response fast enough to capture the early change. A logger supplies more frequent readings, but a slow sensor or badly placed probe can still miss it.
Gas-producing systems need an unobstructed path to the collector; pressure can build behind a blocked tube or stuck plunger. Other rate methods may involve corrosive reagents or hazardous gases. Use the supervised apparatus and precautions specified for the actual reaction.
Continuous monitoring: interpret a progress curve
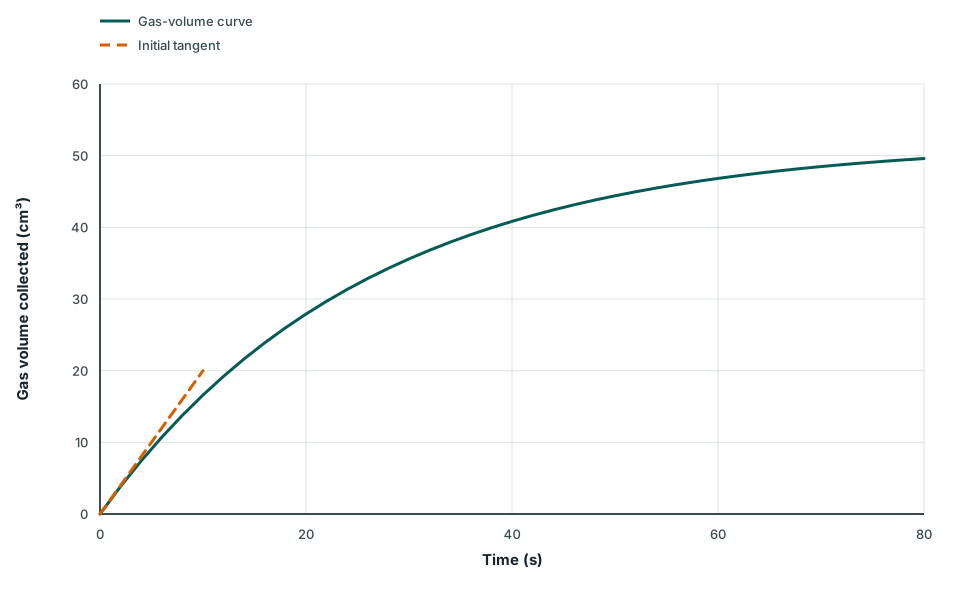
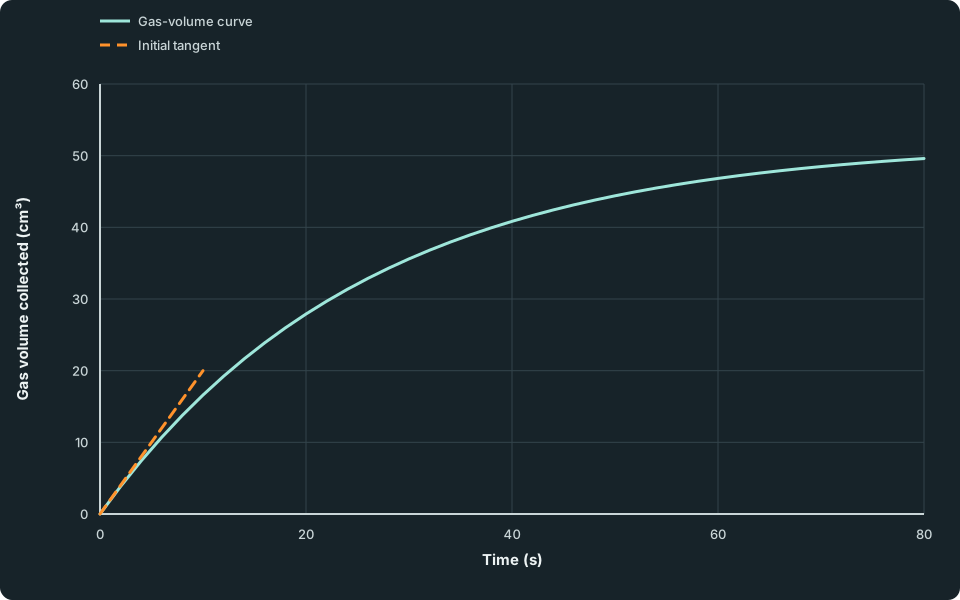
An initial tangent and a slowing gas-volume curve
Gas volume starts at zero and approaches a plateau. The tangent through the origin reaches 20 cm³ at 10 s. The curve is about 27.9 cm³ at 20 s and 40.8 cm³ at 40 s.
Scroll across the figure to read all labels.
View figure data
| Series | Time (s) | Gas volume collected (cm³) |
|---|---|---|
| Gas-volume curve | 0 | 0.0000 |
| Gas-volume curve | 2 | 3.8500 |
| Gas-volume curve | 4 | 7.4150 |
| Gas-volume curve | 6 | 10.7160 |
| Gas-volume curve | 8 | 13.7726 |
| Gas-volume curve | 10 | 16.6030 |
| Gas-volume curve | 12 | 19.2237 |
| Gas-volume curve | 14 | 21.6504 |
| Gas-volume curve | 16 | 23.8975 |
| Gas-volume curve | 18 | 25.9782 |
| Gas-volume curve | 20 | 27.9048 |
| Gas-volume curve | 22 | 29.6888 |
| Gas-volume curve | 24 | 31.3407 |
| Gas-volume curve | 26 | 32.8703 |
| Gas-volume curve | 28 | 34.2866 |
| Gas-volume curve | 30 | 35.5981 |
| Gas-volume curve | 32 | 36.8125 |
| Gas-volume curve | 34 | 37.9369 |
| Gas-volume curve | 36 | 38.9782 |
| Gas-volume curve | 38 | 39.9423 |
| Gas-volume curve | 40 | 40.8350 |
| Gas-volume curve | 42 | 41.6617 |
| Gas-volume curve | 44 | 42.4271 |
| Gas-volume curve | 46 | 43.1359 |
| Gas-volume curve | 48 | 43.7922 |
| Gas-volume curve | 50 | 44.3999 |
| Gas-volume curve | 52 | 44.9626 |
| Gas-volume curve | 54 | 45.4836 |
| Gas-volume curve | 56 | 45.9661 |
| Gas-volume curve | 58 | 46.4128 |
| Gas-volume curve | 60 | 46.8265 |
| Gas-volume curve | 62 | 47.2095 |
| Gas-volume curve | 64 | 47.5642 |
| Gas-volume curve | 66 | 47.8926 |
| Gas-volume curve | 68 | 48.1967 |
| Gas-volume curve | 70 | 48.4783 |
| Gas-volume curve | 72 | 48.7391 |
| Gas-volume curve | 74 | 48.9805 |
| Gas-volume curve | 76 | 49.2041 |
| Gas-volume curve | 78 | 49.4111 |
| Gas-volume curve | 80 | 49.6028 |
| Initial tangent | 0 | 0.0000 |
| Initial tangent | 10 | 20.0000 |
The solid curve shows an illustrative gas-volume record. Its slope is steep initially and becomes smaller as the reaction slows. The plateau means the measured gas volume is no longer increasing; you still need the chemistry and apparatus checks to decide whether this represents completion.
A tangent at the start estimates the initial gas-production rate.
Worked example 1
Calculate the initial gas-volume rate
Problem
Show full solution
Read differences on the tangent
Method
Find the volume rise and time interval between the two tangent points.Reason
The tangent represents the local slope at time zero; later points on the curve would give a different rate.Working
Answer
Δ V = 20.0-0.0 = 20.0 cm³; Δ t = 10.0-0.0 = 10.0 s.Divide rise by interval
Method
Calculate Δ V/Δ t and divide the axis units too.Reason
A gradient measures vertical change per unit horizontal change.Working
Answer
20.0/10.0 = 2.00 cm³ s⁻¹.State what the rate measures
Working
Answer
The initial gas-volume production rate is 2.00 cm³ s⁻¹.
This is a volume rate, not yet a concentration rate. At constant temperature and pressure, gas volume is proportional to gas amount. Converting to mol s⁻¹ requires the gas conditions; converting to the disappearance rate of a reactant also requires stoichiometry. A concentration rate additionally needs the relevant reaction volume.
Check your understanding 1
A reaction produces 27.9 cm³ of gas by 20 s and 40.8 cm³ by 40 s. Its initial gas-volume rate is 2.00 cm³ s⁻¹. Calculate the volume increase and average rate between 20 s and 40 s.
Show the steps Optional working
Show answer
The volume increase is 40.8-27.9 = 12.9 cm³ over 40-20 = 20 s, so the average rate is 12.9/20 ≈ 0.65 cm³ s⁻¹.
Check your understanding 2 Why does this average differ from the initial rate?
The gas volume rises from 27.9 cm³ at 20 s to 40.8 cm³ at 40 s. Explain why the average rate over this interval differs from the 2.00 cm³ s⁻¹ initial rate.
Show answer
The volume increase is 40.8-27.9 = 12.9 cm³ over 40-20 = 20 s, so the average rate is 12.9/20 ≈ 0.65 cm³ s⁻¹. This secant slope averages a later interval during which the reaction has slowed. It is smaller than the initial tangent slope and cannot replace the rate at time zero.
Check your understanding 3 Explain what the gradient measures
Experiment P has an initial gas-volume gradient of 2.40 cm³ s⁻¹; Q has 144 cm³ min⁻¹. The gases are measured at the same temperature and pressure. Convert Q’s rate to cm³ s⁻¹. Assess the two rate claims in the following question.
Show answer
Q’s gradient is 144/60 = 2.40 cm³ s⁻¹, equal to P’s.
Check your understanding 4 Assess both claims after converting units
P produces gas at 2.40 cm³ s⁻¹ and Q at 144 cm³ min⁻¹, both at the same gas temperature and pressure. Assess the claim that Q is sixty times faster and has a larger reactant concentration-change rate.
Show answer
Q’s gradient is 144/60 = 2.40 cm³ s⁻¹, equal to P’s. At the same gas temperature and pressure, equal volume rates give equal gas-amount rates, so Q is not sixty times faster. The reactant concentration-change rates cannot be compared from these gradients alone: each reaction’s stoichiometry and solution volume are also needed. Equal gas-production rates need not give equal reactant concentration-change rates.
Clock methods: compare times to the same extent
A clock reaction reaches a visible endpoint after a fixed amount of product has formed or a fixed amount of a reacting species has been used up. If the same small extent is used in each experiment, its average rate is proportional to 1/t:
The small extent makes this average a useful approximation to the initial rate, because reactant concentrations have changed little. The approximation fails if a large fraction has reacted before the endpoint.
Control the endpoint chemistry, total volume and observation procedure. If one experiment requires twice as much product to reach its colour change, a longer time need not mean a slower reaction. Also, 1/t has units s⁻¹; it is a relative-rate measure, not automatically a molar concentration-change rate.
Check your understanding 5 Decide whether two clock times can be compared
Experiments A and B use the same small chemical extent and total volume. Their clock times are 12.0 s and 24.0 s. Find the initial-rate ratio A:B using the clock approximation. Compare a changed endpoint amount in the following question.
Show answer
The ratio is (1/12.0):(1/24.0) = 2:1, so A is approximately twice as fast initially.
Check your understanding 6 Explain why the third clock time needs a different comparison
Clock times A and B are 12.0 s and 24.0 s for the same small extent and total volume. Explain the rate ratio. A third experiment doubles the endpoint amount; explain whether 1/t alone can compare it with A or B.
Show answer
The ratio is (1/12.0):(1/24.0) = 2:1, so A is approximately twice as fast initially. The third experiment uses a different endpoint extent. Its time includes the effect of needing more reaction, so 1/t alone is not a valid like-for-like rate comparison.
Choose the observable before choosing the calculation. A continuous curve supports gradients at chosen times; a fixed-extent clock supports relative comparisons while its assumptions hold.
Spotted an error? Report a correction
Syllabus and review details
- GCE A-Level H2 Chemistry 2027 · 9476-2027
9476 (2027), complete syllabus
Last reviewed: