Manufacturing Ammonia (Haber Process)
Haber process: feedstocks, reversible equation, ammonia separation, gas recycling and interpretation of supplied industrial data.
On this page
Ammonia manufacture has two connected questions: how do we recover the product from a reversible reaction, and how do we choose conditions that produce it economically? Follow the gases through the plant, then use supplied data to compare rate, ammonia content and cost.
1. Definition
A. Haber process
The Haber process manufactures ammonia by reacting nitrogen with hydrogen in a reversible reaction. Ammonia is separated from the reactor mixture and unreacted gases are recycled.
2. Key Ideas
- In the process model used for this course, nitrogen comes from air and hydrogen is obtained by cracking hydrocarbons from crude oil.
- Balanced equation: N₂(g) + 3H₂(g) ⇌ 2NH₃(g).
- The double arrow shows that both forward and backward reactions occur.
- An iron catalyst increases reaction rate.
- Cooling condenses ammonia; unreacted nitrogen and hydrogen are recycled.
3. Detailed Explanations
- Fresh feed: nitrogen and hydrogen in a 1:3 mole ratio.
- Reactor outlet: ammonia together with unreacted nitrogen and hydrogen.
- Cooling: ammonia condenses and is removed as a liquid.
- Recycling: the remaining gases return to the reactor.
A. Raw materials and equation
- Nitrogen, N₂(g), is obtained from air.
- Hydrogen, H₂(g), can be obtained by cracking hydrocarbons from crude oil. This is the route required here; other industrial hydrogen-production routes also exist.
N₂(g) + 3H₂(g) ⇌ 2NH₃(g)
The coefficients give the reacting mole ratio. They do not mean that every pass converts all the feed gases into ammonia. The reverse reaction breaks ammonia down into nitrogen and hydrogen. At equilibrium in a closed system, the forward and reverse reactions continue at equal rates; the amounts of the gases stay constant, rather than necessarily becoming equal.
B. Reactor, catalyst and separation
The gases pass through a reactor containing an iron catalyst. The catalyst provides an alternative pathway with lower activation energy, increasing the rate of reaction without being consumed overall. It speeds both directions and helps the mixture reach equilibrium sooner; at the same temperature and pressure it does not increase the equilibrium yield.
The outlet mixture is cooled. Ammonia condenses and is removed, while unreacted nitrogen and hydrogen remain gaseous and are returned to the reactor.
C. Why recycling matters
Recycling reduces waste and gives unreacted feed gases another opportunity to react. It improves the use of raw materials but does not mean that a single pass has 100% conversion.
D. Read pressure and temperature data
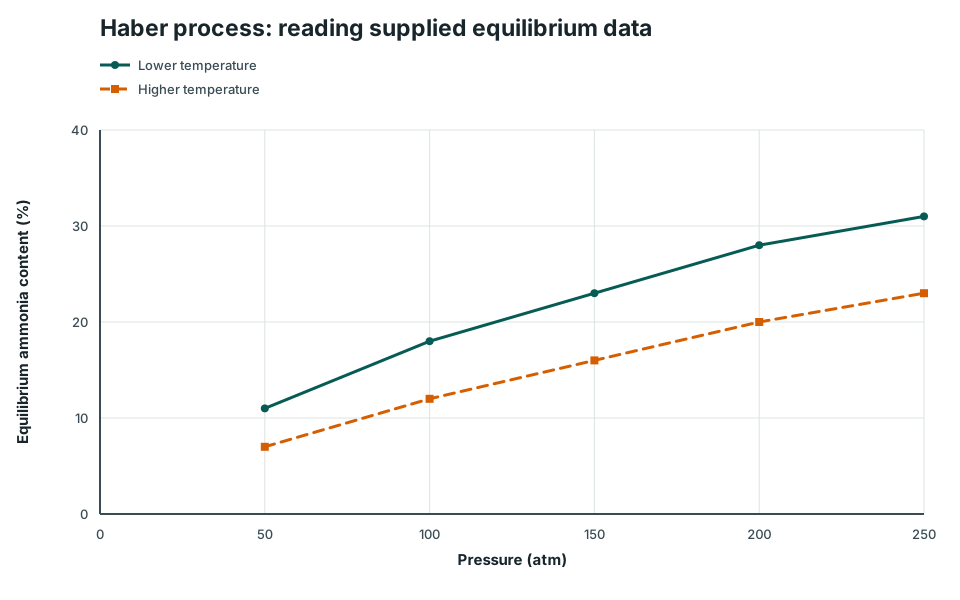
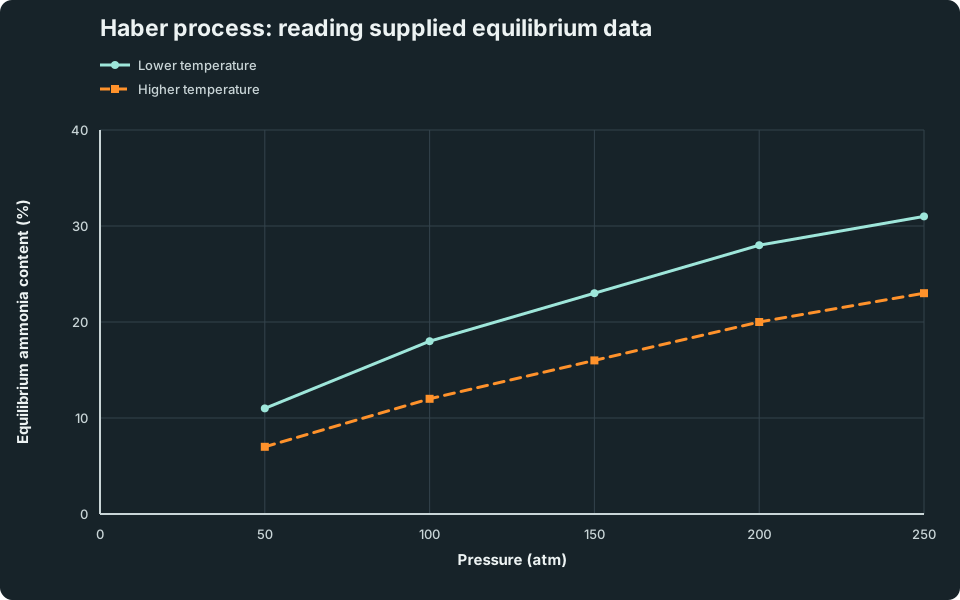
Compare one variable at a time. To read a pressure trend, follow one temperature’s line. To compare temperatures, use the same pressure on both lines.
Haber process: reading supplied equilibrium data
Equilibrium ammonia content is plotted against pressure for a lower and a higher temperature. At 100 atm the lower-temperature value is 18%; at 250 atm it is 31%. At 200 atm the two temperatures give 28% and 20% respectively.
Scroll across the graph to read all labels.
View figure data
| Pressure (atm) | Lower temperature | Higher temperature |
|---|---|---|
| 50 | 11 | 7 |
| 100 | 18 | 12 |
| 150 | 23 | 16 |
| 200 | 28 | 20 |
| 250 | 31 | 23 |
These are constructed practice data from an illustrative ideal-gas equilibrium model, rounded to whole percentages, not measurements from a particular plant. You do not need to calculate the model’s values; read and compare the supplied points. The temperatures are labelled lower and higher because the task is to interpret the supplied relationship, not memorise operating temperatures.
The vertical axis shows the percentage of the equilibrium gas mixture that is ammonia, by amount of substance. It is not the percentage yield calculation from Yield and Purity. With the same initial nitrogen–hydrogen feed, a higher equilibrium ammonia content indicates more feed has reacted, but the two percentages have different denominators.
At the lower temperature, raising pressure from 100 to 250 atm raises ammonia content from 18% to 31%: an increase of 13 percentage points. At 200 atm, the two curves give 28% at the lower temperature and 20% at the higher temperature. The graph gives equilibrium composition; it gives no information about how long the reaction takes or what the equipment costs.
Explore the same trade-off below: move along one temperature’s line to see the effect of pressure, then change the temperature and compare the ammonia content with how fast equilibrium is reached.
Haber process at 450 °C and 200 atm with an iron catalyst: 26 % ammonia at equilibrium, reached 1.0 times as fast as at 450 °C and 200 atm with iron.
- [N₂]
- 1.00 mol/dm³
- [H₂]
- 3.00 mol/dm³
- [NH₃]
- 0 mol/dm³
- [NO₂]
- 1.00 mol/dm³
- [N₂O₄]
- 3.00 mol/dm³
- Qc
- 0
- Kc
- 0.185
- Pressure
- 237 atm
- NH₃ at equilibrium
- 25.9 %
- Relative rate
- 1.0
Try this
0 of 4 doneLet nitrogen and hydrogen reach equilibrium, then add nitrogen and watch equilibrium re-establish. (not done yet)
Adding N₂ makes Qc smaller than Kc, so the forward reaction speeds up until the rates are equal again. Some of the added N₂ is used up, more NH₃ forms, and Kc is unchanged.
Squeeze the NO₂ and N₂O₄ syringe at equilibrium and watch the colour. (not done yet)
Squeezing raises every concentration, so the brown darkens at once. The mixture then shifts towards N₂O₄, which has fewer gas molecules, and the colour partly fades.
Heat an equilibrium mixture and compare Kc before and after. (not done yet)
Both forward reactions are exothermic (ΔH is negative), so heating lowers Kc and the mixture shifts left. Only a temperature change alters Kc.
In Haber conditions, compare the ammonia content and the rate at 350 °C and at 450 °C at the same pressure. (not done yet)
A lower temperature gives more ammonia at equilibrium but reaches it far more slowly. Plants use about 450 °C with an iron catalyst as a compromise, and about 200 atm because higher pressures cost more to build and run.
E. Use rate and cost evidence to choose conditions
Suppose a plant trial supplies the following additional illustrative data. All trials use the same iron catalyst and feed ratio. Rate and cost are relative indices: 1.0 is the value in trial A. They are different quantities, so do not subtract a cost index from a rate index.
| Trial | Temperature | Pressure / atm | Equilibrium ammonia content / % | Initial production-rate index | Operating-cost index |
|---|---|---|---|---|---|
| A | Lower | 100 | 18 | 1.0 | 1.0 |
| B | Lower | 200 | 28 | 1.6 | 2.5 |
| C | Higher | 200 | 20 | 3.0 | 3.0 |
- A → B: the supplied rate and ammonia content increase, but compression and equipment cost also increase.
- B → C: the supplied rate increases while equilibrium ammonia content decreases. Faster production and a higher equilibrium amount are different advantages.
- Decision: identify the plant’s requirement, then quote both a benefit and a cost or limitation. The largest ammonia percentage alone does not establish the cheapest or most productive plant.
Try independently: A plant requires an initial production-rate index of at least 2.0. Which supplied trial meets that requirement? Give one disadvantage compared with trial B.
Show answer and reasoning
Trial C is the only supplied trial meeting the requirement: its rate index is 3.0, whereas B is 1.6 and A is 1.0. Compared with B, it has lower equilibrium ammonia content (20% rather than 28%) and a higher cost index (3.0 rather than 2.5). This conclusion depends on the stated requirement and supplied data; it does not establish a universal operating condition.
4. Common Mistakes
- Writing an irreversible arrow instead of ⇌.
- Using the wrong ratio; the equation shows 1N₂:3H₂:2NH₃.
- Saying the catalyst is consumed or that it creates extra ammonia by itself.
- Saying recycling changes the balanced equation or guarantees complete conversion in one pass.
5. Exam Tips
- Include state symbols when asked for the full equation.
- For the process description, include cooling/condensation, ammonia removal and recycling.
- Use the supplied values to justify a condition: identify the quantity, quote the comparison and explain a benefit together with a limitation. Reversible Reactions develops the wider reaction model.
6. Worked Examples
Modelled example 1
Balance the reversible equation
Problem
Study the worked solution
Balance nitrogen atoms
Method
Place 2 before ammonia.Reason
One N₂ molecule contains two nitrogen atoms.Working
N₂ + H₂ ⇌ 2NH₃.Balance hydrogen atoms
Method
Place 3 before hydrogen.Reason
Two ammonia molecules contain six hydrogen atoms.Working
N₂ + 3H₂ ⇌ 2NH₃.Add states and reversible arrow
Method
Show all gases and use ⇌.Reason
The industrial reaction is reversible and reaches equilibrium.Working
N₂(g) + 3H₂(g) ⇌ 2NH₃(g).
Guided practice 2
Read a pressure trend
Problem
State direction and size of change
Hints
Hint 1: compare in order
Hint 2: percentage points
View solution step by step
State the trend
Method
Describe equilibrium ammonia content as increasing with the supplied pressure change.Reason
The value rises from 18% to 31% at the same temperature.Working
100 atm: 18%; 250 atm: 31%.Quantify the increase
Method
Subtract the two percentages.Reason
The absolute difference is expressed in percentage points.Working
31-18 = 13 percentage points.
Common misconception 3
State the catalyst’s role
Learner claim
Separate rate from equilibrium yield
View solution step by step
Correct the rate claim
Method
State that iron increases reaction rate.Reason
It provides an alternative pathway with lower activation energy.Working
Both forward and reverse reactions reach equilibrium faster.Correct yield and consumption
Method
State that iron is not used up and does not change equilibrium yield.Reason
At a fixed temperature and pressure, a catalyst helps equilibrium to be reached faster without changing the equilibrium composition.Working
Iron is a reusable catalyst, not a reactant.
Challenge 4
Separate and recycle
Process-flow transfer
Explain what happens after the Haber reactor mixture is cooled and why the remaining gases are recycled.
Track each component
Hints
Hint 1: different physical behaviour
On cooling, ammonia is separated by condensation while nitrogen and hydrogen remain gases.
Hint 2: avoid wasting feed
Send unreacted gases through the reactor again.
View solution step by step
Separate ammonia
Method
Cool the mixture so ammonia condenses and remove it.
Reason
Ammonia is separated from nitrogen and hydrogen by its different condensation behaviour.
Working
Liquid ammonia leaves the gas stream.Recycle feed gases
Method
Return unreacted N₂ and H₂ to the reactor.
Reason
Repeated passes improve overall raw-material use without claiming complete conversion per pass.
Working
Unreacted gases are recycled.
7. Mind Stretchers
Mind stretcher 1: Single pass versus overall processExtension
Question: Why can recycling improve overall raw-material use even when the conversion per pass is unchanged?
Show Answer
Unreacted gases pass through the reactor again instead of being discarded, so more of the original feed can react over repeated passes.
Practise and check
Use the Acid–Base Chemistry topic check to practise process flow and decisions based on supplied industrial data.
Syllabus and review details
- SEC G3 Pure Chemistry 2027 · 2027
Content structure and subject content, PDF pages 9–24
Last reviewed: