Reversible Reactions
Reversible reactions for K324 / 6092: forward and backward reactions, the Haber equation, and interpreting industrial temperature, pressure and catalyst data.
On this page
Many reactions you have met are written with a one-way arrow. The Haber reaction needs a different symbol: ammonia can form from nitrogen and hydrogen, and ammonia can also break down into those gases. In this lesson, read that symbol and use supplied data to judge industrial choices. You do not need to predict equilibrium changes using Le Chatelier’s principle.
1. Definition
A reversible reaction can proceed in both directions under suitable conditions:
- the forward reaction converts reactants into products;
- the backward reaction converts products back into reactants.
The paired arrow, ⇌, shows that both directions are possible. It does not mean that reactants and products are present in equal amounts.
Be able to recognise a reversible equation and interpret data about industrial conditions. Detailed equilibrium calculations are not required on this page.
2. Key Ideas
Two questions help you read reversible-reaction data:
- How quickly does the mixture change? This is a question about reaction rate.
- What mixture is eventually reached? This is a question about equilibrium composition.
In a closed mixture at fixed conditions, dynamic equilibrium is reached when the forward and backward reactions have equal rates. Both reactions continue, but there is no overall change in the amounts present. Equal rates do not mean equal amounts.
A catalyst speeds up both directions and helps the mixture reach equilibrium sooner. At the same temperature and pressure, it does not change the equilibrium composition. It may give more product within a short time when the uncatalysed mixture has not yet reached equilibrium.
The paired arrow describes two possible chemical directions. It does not show how much of each substance is present or which direction is faster.
3. Detailed Explanations
A. Haber Process: the syllabus case study
Nitrogen and hydrogen react reversibly to form ammonia:
N₂(g) + 3H₂(g) ⇌ 2NH₃(g)
The equation is balanced: one nitrogen molecule and three hydrogen molecules form two ammonia molecules. All species are gases in the reactor.
The full feedstock, reactor, separation and recycling sequence belongs in Manufacturing Ammonia. Here, use the equation only as the main example of reversibility.
B. Interpreting industrial-condition data
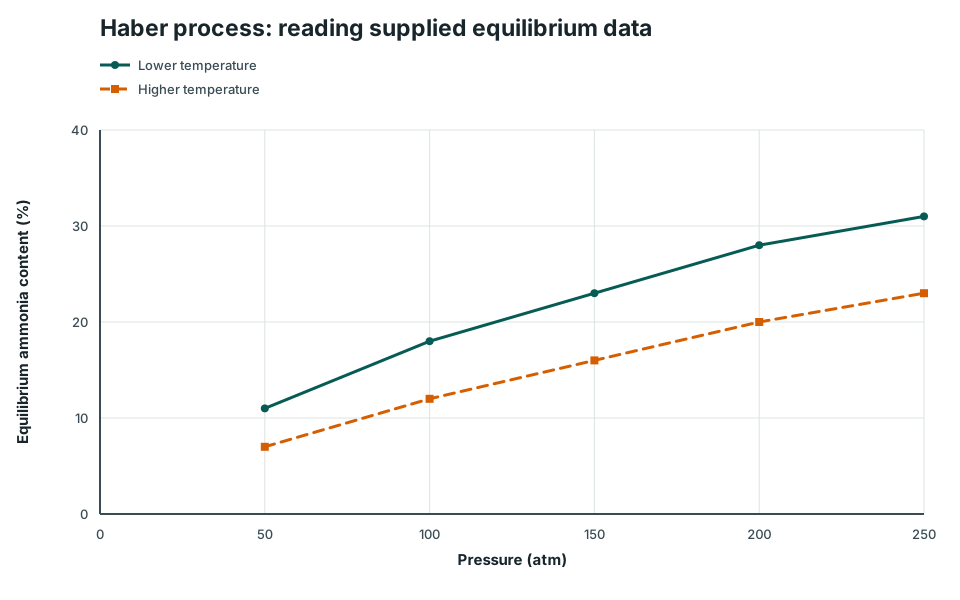
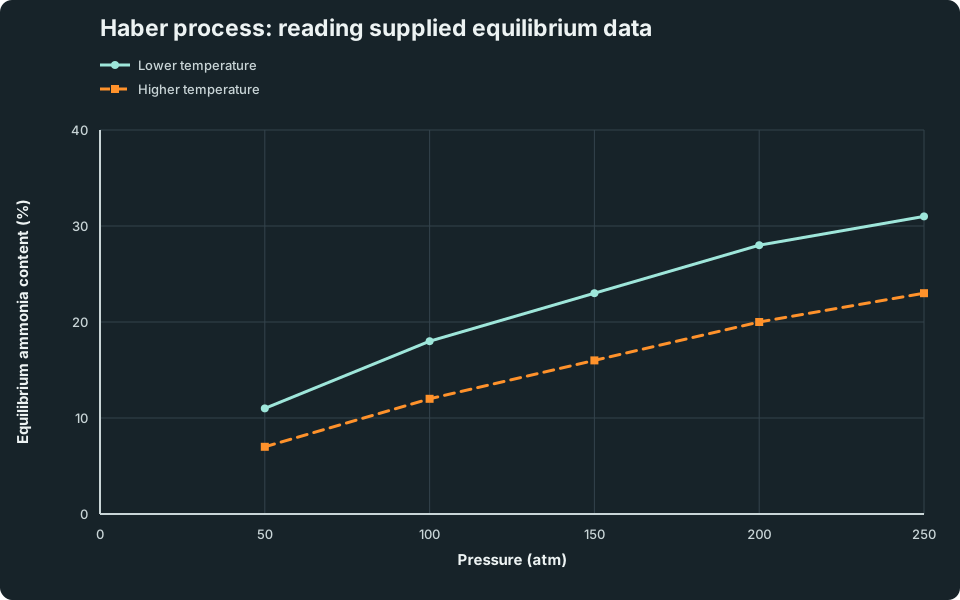
Read the axes and caption before choosing conditions. The following constructed graph shows equilibrium ammonia content: ammonia as a percentage of the gas mixture, not percentage yield calculated from a theoretical mass. Each point uses the same initial nitrogen:hydrogen feed ratio of 1:3, with no ammonia in the initial feed.
Haber process: reading supplied equilibrium data
Equilibrium ammonia content is plotted against pressure for a lower and a higher temperature. At 100 atm the lower-temperature value is 18%; at 250 atm it is 31%. At 200 atm the two temperatures give 28% and 20% respectively.
Scroll across the graph to read all labels.
View figure data
| Pressure (atm) | Lower temperature | Higher temperature |
|---|---|---|
| 50 | 11 | 7 |
| 100 | 18 | 12 |
| 150 | 23 | 16 |
| 200 | 28 | 20 |
| 250 | 31 | 23 |
To compare pressures, stay on one temperature curve. To compare temperatures, use points at the same pressure. At 200 atm, for example, the lower-temperature curve shows 28% ammonia and the higher-temperature curve shows 20%.
The graph shows no reaction times, energy costs or equipment costs. Those need separate evidence. A greater equilibrium ammonia content does not by itself tell you how much ammonia a factory produces per hour.
| Evidence supplied separately | What it helps you judge |
|---|---|
| a faster reaction at higher temperature | how quickly ammonia can be produced; compare this with the equilibrium-composition data |
| greater compression energy and stronger equipment at higher pressure | the extra operating and equipment costs |
| faster approach to equilibrium with iron | the rate benefit of a catalyst; the equilibrium composition at the same conditions stays unchanged |
Give the benefit supported by the data, then the relevant drawback. A useful condition must meet the production need while accounting for costs and safety. There is no universal rule to choose the highest, lowest or middle value.
4. Common Mistakes
- Reading ⇌ as “equal amounts” instead of “both directions are possible”.
- Saying a catalyst increases the equilibrium amount of ammonia. At unchanged conditions, it helps the mixture reach the same equilibrium composition sooner.
- Claiming the highest temperature is automatically best because it gives the fastest rate; industrial choices also consider yield, cost and safety.
- Treating equation coefficients as the actual mixture composition. They give the reacting ratio, not the amounts present in the reactor at a particular time.
- Treating a supplied trend graph as an experiment you performed. Quote only what the data shows.
5. Exam Tips
“As [condition] increases, the data show [trend]. This improves [rate or equilibrium ammonia content], but [cost, safety or yield trade-off]. Therefore the chosen condition is a compromise.”
- Include units when quoting values from a table or graph.
- Compare like with like: identify which variable is controlled and which is changed.
- State whether you are discussing rate, equilibrium composition, or overall use of raw materials. Percentage yield is a separate calculation comparing actual with theoretical product.
- For the full Haber-process lesson, continue to Manufacturing Ammonia.
6. Worked Examples
Modelled example 1
Read the arrow
Problem
Study the worked solution
Read the forward direction
Method
Describe nitrogen and hydrogen forming ammonia.Reason
The left-to-right arrow represents the forward reaction.Working
N₂ + 3H₂ → 2NH₃.Read the backward direction
Method
Describe ammonia forming nitrogen and hydrogen under suitable conditions.Reason
The paired arrow states that the chemical change can proceed in reverse.Working
2NH₃ → N₂ + 3H₂; the reaction is reversible.
Guided practice 2
Interpret temperature data
Problem
Weigh both trends
Hints
Hint 1: do not optimise one measure
View solution step by step
State the opposing effects
Method
Compare the ammonia contents at 200 atm, then add the separate rate evidence.Reason
The graph gives equilibrium composition; the rate trial gives speed. They measure different things.Working
Lower temperature: 28% ammonia, slower reaction. Higher temperature: 20% ammonia, faster reaction.Justify the compromise
Method
Find out whether each condition meets the required production rate and what it costs.Reason
Neither the graph nor “faster” alone establishes which condition is most useful.Working
Choose a condition only after weighing rate, equilibrium composition and cost. A middle temperature is not automatically best.
Common misconception 3
Catalyst trap
Claim to correct
Correct: “At the same temperature and pressure, iron increases the equilibrium amount of ammonia.”
Separate speed from final composition
View solution step by step
State the kinetic role
Method
Describe iron as a catalyst providing a lower-activation-energy pathway.
Reason
This increases reaction rate and reaches equilibrium sooner.
Working
Iron speeds forward and backward reactions.
Remove the unsupported yield claim
Method
Do not claim that iron increases equilibrium yield.
Reason
A catalyst does not shift the equilibrium position.
Working
Iron helps the mixture reach the same equilibrium composition sooner.
Examiner practice 4
Interpret pressure data
Exam-style practice
Balance production with cost and safety
View solution step by step
State a production benefit
1 markMethod
Read the ammonia content at the two pressures on the same curve.Reason
Temperature and initial feed composition are held constant, so this is a pressure comparison.Working
Ammonia content rises from 18% to 31%: an increase of 13 percentage points.State an industrial drawback
1 markMethod
Use the stated extra compression energy or stronger equipment.Reason
Operating safely at higher pressure needs more energy and stronger equipment.Working
Drawback: greater cost/energy/safety demand.Reach a balanced conclusion
1 markMethod
Weigh the extra ammonia content against the extra costs; more evidence is needed to choose.Reason
The graph does not provide rates, costs or the required production target.Working
250 atm gives more ammonia at equilibrium, but these facts alone do not establish the better operating pressure.
Self-mark with the mark scheme
Compare your response with each mark point. Select a point only when your response contains that evidence.
Self-mark benefit, drawback and balanced conclusion.
Guided practice 5
Process interpretation
Follow the process
Connect equilibrium to the process loop
Hints
Hint 1: one pass is incomplete
View solution step by step
Explain the unreacted gases
Method
State that one pass does not convert all N₂ and H₂.Reason
The reaction is reversible, and the mixture leaving this reactor still contains reactants. Do not assume a practical reactor has necessarily reached equilibrium.Working
Unreacted feed remains after ammonia condensation.Explain recycling
Method
Return those gases to the reactor.Reason
Repeated opportunities to react improve overall use and reduce waste.Working
N₂ and H₂ are recycled.
7. Mind Stretchers
Mind stretcher 1: Distinguish reaction from processExtension
A reactor is fed 100 mol of nitrogen and 300 mol of hydrogen. In one pass, 40 mol of nitrogen reacts according to N₂ + 3H₂ ⇌ 2NH₃. A separator then removes all the ammonia formed. Calculate the amounts of nitrogen and hydrogen available for recycling, and explain why recycling helps.
Show Answer
The reaction uses 3 × 40 = 120 mol of hydrogen and forms 2 × 40 = 80 mol of ammonia. The separator removes the ammonia. The unreacted gases are 100 - 40 = 60 mol of nitrogen and 300 - 120 = 180 mol of hydrogen. Recycling gives these gases another opportunity to react, improving overall use of the feed. It does not mean that all reactants were converted in the first pass.
Mind stretcher 2: Compare early and equilibrium resultsExtension
Two identical closed mixtures start with the same amounts of nitrogen and hydrogen. They are kept at the same temperature and volume; only mixture B has an iron catalyst. The table gives illustrative results. Both mixtures have reached equilibrium by 120 minutes.
| Time / min | Ammonia in A / mol | Ammonia in B / mol |
|---|---|---|
| 5 | 0.10 | 0.60 |
| 30 | 0.40 | 0.80 |
| 120 | 0.80 | 0.80 |
A student uses the 5-minute results to claim that iron increases the equilibrium amount of ammonia. Explain why the claim is wrong, using the data.
Show Answer
At 5 minutes, B contains more ammonia (0.60 mol compared with 0.10 mol), showing a faster approach to equilibrium. Those early results are not equilibrium amounts. By 120 minutes, both mixtures contain 0.80 mol of ammonia at equilibrium. Iron helps equilibrium be reached sooner, but has not changed the final equilibrium amount under these fixed conditions.
Practise and check
Continue with the Acid–Base Chemistry topic check to practise reversible reactions and Haber-process decisions.
Open the topic checkSyllabus and review details
- SEC G3 Pure Chemistry 2027 · 2027
Content structure and subject content, PDF pages 9–24
Last reviewed: